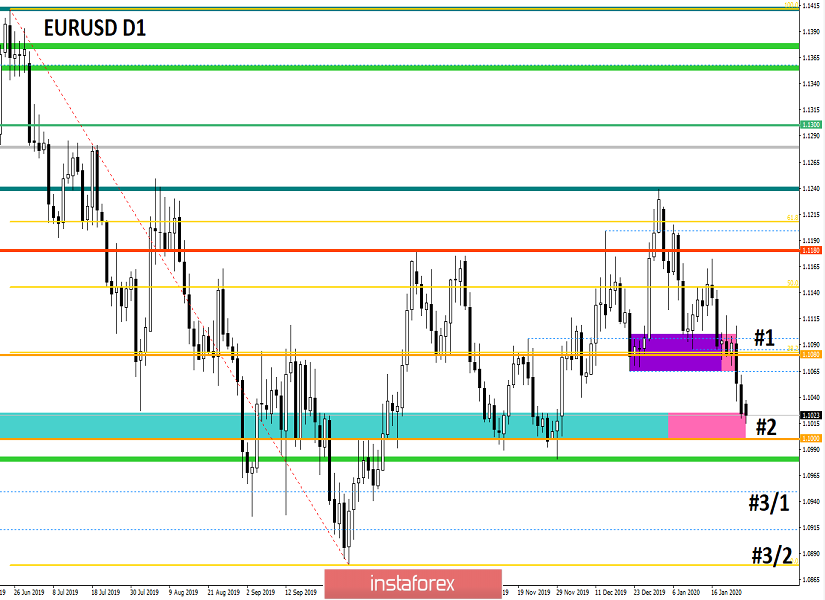
From a complex analysis, we see the continuing inertia set by the market last Thursday. In fact, during this period, the quote overcame the variable flat, the range level of 1.1080, and also moved closer to the borders of the subsequent level of 1.1000. This kind of move directly affected the structure of the oblong correction, which was under the impact of the recovery process. The current position of the quote was last recorded at the end of November, where there was an attempt to storm the psychological level of 1.1000, which at the same time reflects the second stage of recovery. If we refer to the regularity, we have already reached the stop zone, where it is possible to form a slowdown and subsequent rebound. At the same time, traders assume that the downward move set at the beginning of the year is more powerful than it was on the previous attempt, thus there is a chance of a breakdown. If a miracle happens and the level falls, the probability of closing the oblong correction will increase significantly.
From volatility, we see stable indicators, however, it is worth adjusting since they are in the structure of the inertial course.
When we analyze the Friday day by the minute, we see a kind of step-by-step process that is revealed by an inertial process. The main activity spikes occurred during the period of 10:30-17:30 (trading terminal time). The subsequent oscillation was in terms of stagnation with an amplitude of about 10 points.
As discussed in the previous review, speculators actively worked for a decrease during the entire inertial course, where the main prospect was to get closer to the psychological level of 1.1000, which conditionally happened.
Looking at the trading chart in general terms (the daily period), we see a 62% improvement over the oblong correction. The main support point of the correction is located around 1.0879, which reflects the final stage of the recovery (#3/2).
Friday's news background had preliminary data from the eurozone PMI, where they were waiting for optimistic indicators, but was disappointed. So, the composite index of business activity in the manufacturing sector (Markit) remained unchanged at 50.9, with growth forecast to 51.2. At the same time, the index of business activity in the services sector (Markit) fell from 52.8 to 52.2. In the United States, a similar PMI was published, where the composite PMI rose from 52.7 to 53.1.
The market reaction to the statistics was paired with the strengthening of the US dollar.
In terms of the general information background, we have hysteria about the coronavirus, which has not yet managed to escape from the news headlines. World markets are skeptical about this phenomenon, and only in the minds of journalists is the collapse of everything.
In turn, US Commerce Secretary Wilbur Ross made comments on the introduction of additional duties by the European Union on products of foreign companies that were produced with a high level of greenhouse gas emissions.
"Depending on what this carbon tax looks like, we will react. If protectionism is at its core, as in the case of the digital tax, we will respond," said Wilbur Ross.
Let me remind you that at the beginning of 2018, the European Commission presented the concept of the EU's transition to a zero-carbon economy by 2050, but there are still no specific calculations on how it intends to do this in practice.
Today, in terms of the economic calendar, we have data on sales of new homes in the United States, where they are waiting for a reduction from 725 thousand to 719 thousand.
Further development
Analyzing the current trading chart, we see that the quote shows extremely low activity due to strong pressure from the psychological level of 1.1000, which constrains the ardor of sellers. It plays the role of the regularity that pursues this process in history. In this regard, we see a slowdown that may be delayed indefinitely, but there is a downside to this scenario. So, the previously set inertial tact does not stop and is gradually fixed below the control level. We will see a completely different alignment here, but this should be written a little later. First, you need to reach the mark of 1.1000.
In terms of the emotional component, we see how speculators are afraid of this level, activity slows down, the market goes into a stand-up mode, but at the slightest shift in trading forces, acceleration can occur.
Detailing the available trading day every minute, we see a closed oscillation with an amplitude of a little more than 20 points. Consolidation with the accumulation effect.
In turn, traders do not rush to action due to the high risk of a rebound. Thus, the trading strategy is selected using the "Breakout/Rebound" method.
It is likely to assume that the psychological level of 1.1000 will continue to put pressure on the quote, where market participants will simply take a position outside the market, tracking the behavior of the quote and the price-fixing point. The reference values for making a trading decision are the coordinates 1.0980 - sell and 1.1040 - buy.
Based on the above information, we will output trading recommendations:
- Buy positions will be considered in the event of a rebound from the psychological level of 1.1000 and a price fix higher than 1.1040.
- We consider selling positions if the downward interest is held and the price is fixed below 1.0980. The perspective of the move is located in the following stages: #3/1-1.0950 and #3/2-1.0879.
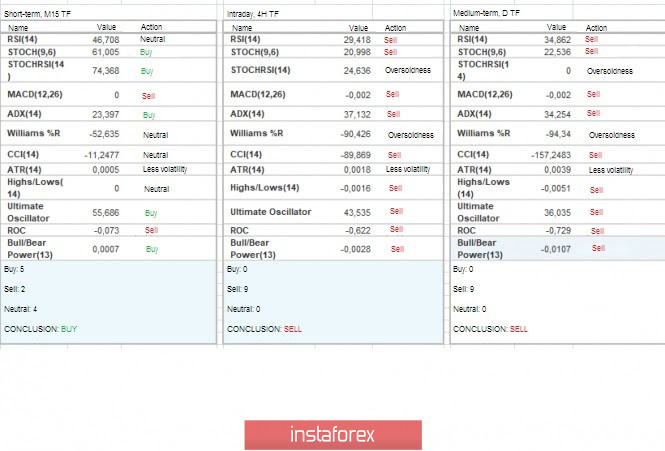
Indicator analysis
Analyzing different sectors of timeframes (TF), we see that the indicators of technical instruments keep the downward interest due to an earlier inertial move. In turn, minute intervals display variable interest due to stagnation.
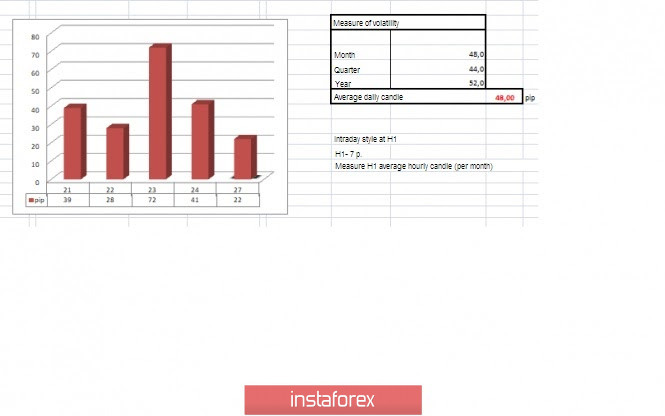
Volatility per week / Measurement of volatility: Month; Quarter; Year.
The volatility measurement reflects the average daily fluctuation, based on the calculation for the Month / Quarter / Year.
(January 27 was based on the time of publication of the article)
The current time volatility is 22 points, which is extremely low for this time interval. It is likely to assume that if the psychological level continues to exert pressure on the quote, then we will probably find ourselves in the narrow limits of a variable flat with low volatility. An alternative scenario is considered in the case of a breakout level, where volatility will increase significantly.
Key levels
Resistance zones: 1.1080**; 1.1180; 1.1300**; 1.1450; 1.1550; 1.1650*; 1.1720**; 1.1850**; 1.2100.
Support zones: 1.1000***; 1.0900/1.0950**;1.0850**; 1.0500***; 1.0350**; 1.0000***.
* Periodic level
** Range level
*** Psychological level
***** The article is based on the principle of conducting a transaction, with daily adjustments.