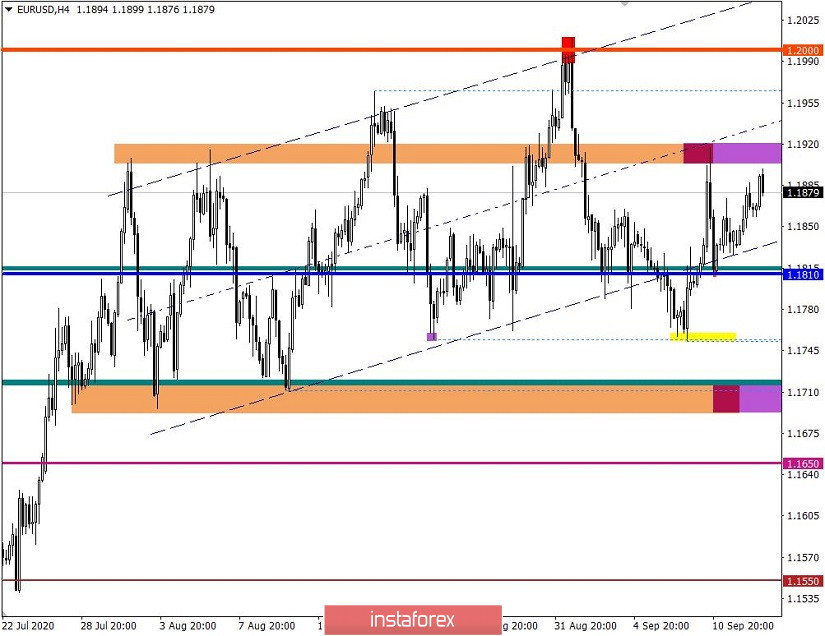
The euro/dollar pair, moving from the average level of 1.1810, reached the upper border of the side channel 1.1700/1.1910, where a slowdown naturally appeared which led to a pullback.
The theory of the zigzag-shaped pattern, described in the previous analytical review, partially coincided in the market at the time of the breakdown of the high (1.1874) on September 11. This move pointed to local operations towards values of 1.1900-1.1910, which resulted in profit from the market.
A breakout of the Zigzag-shaped model in the upward direction is not yet considered a full-fledged signal of the end of the downward cycle set by the market on September 1. The quote, as before, is located within the boundaries of the flat channel 1.1700/1.1810/1.1910, which means that another move of 1.1910 --> 1.1810 --> 1.1700 may occur, following the natural basis of the side channel.
On the other hand, drastic changes should be expected in case of price consolidation above 1.1920/1.1930, which may lead to the restoration of long operations and, as a result, a breakdown of the psychological level of 1.2000.
Analyzing the last trading day by the fifteen-minute, you can see that the round of long positions arose at the very start of trading (00:00) and lasted until 13:00 UTC+00, which was followed by a pullback and then stagnation.
In terms of daily dynamics, the lowest volatility indicator for five trading days is recorded. It amounted to 55 points, which is 32% below the average. The decline in activity is temporary, where everything can change quickly due to a strong information and news background.
As discussed in the previous review, traders worked according to the breakout method of the boundaries of the previous trading day 1.1810/1.1874, which should have led to a local movement in the market. The forecast coincided and the level of 1.1874 was broken in the direction of 1.1900.
Looking at the trading chart in general terms (daily period), you can see the price movement along a conventional sideways course for as long as six weeks, which indicates a slowdown in the medium-term upward trend.
The news background of the past day contained data on the volume of industrial production in the European Union for July, the rate of decline of which slowed down from -12.3% to -7.7% against the forecast of -7.6%. It is worth recalling that the industrial decline is not a local factor for Europe. This process was observed for several years.
The market did not react to the statistics.
In terms of the information background, the market reacts emotionally to the Brexit process, which has moved to a new level of confusion with the arrival of autumn, risking Britain's exit from the European Union without a deal at all.
This background will steadily heat up the interest of speculators, which is why it is necessary to constantly monitor the information flow for Brexit tags.
For the economic calendar, we have data on the volume of industrial production in the United States for August, where a decline is predicted. At the same time, a two-day meeting of the Federal Open Markets Committee starts today, the results of which will be announced tomorrow at 18:00 Universal time. This factor, as a Fed meeting, systematically affects market participants, where at first there may be a lull, but then acceleration.
Further development
Analyzing the current trading chart, you can see the same price pullback from the level of the 1.1900/1.1910 area, where the quote came during the Asian session. It can be assumed that the natural basis associated with price fluctuations within the 1.1700/1.1810/1.1910 flat is still relevant in the market, which means that we should not exclude a rise in the volume of short positions and price movement towards 1.1860 - 1.1810 - 1.1700.
An alternative scenario of market development considers consolidating the price above the local high (1.1917) on September 11, which leads to a violation of the side channel cycle and, as a result, an increase in the volume of long positions towards the psychological level of 1.2000.
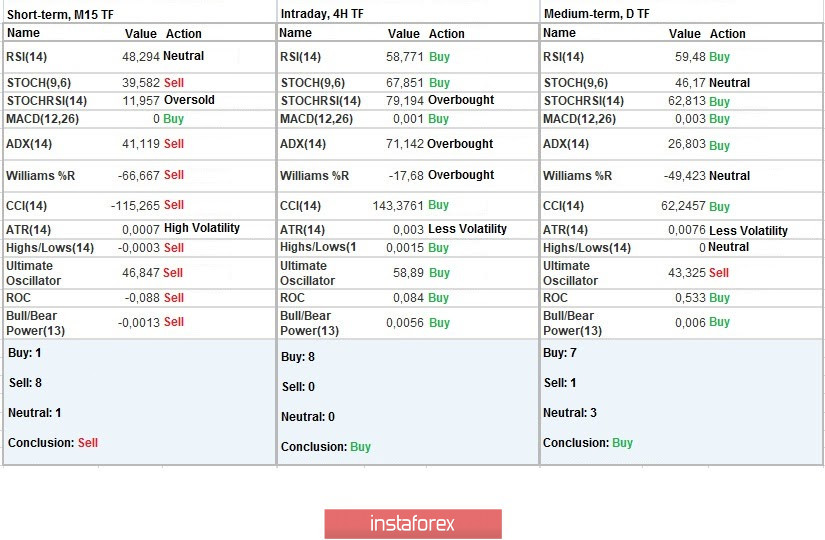
Indicator analysis
Analyzing different sectors of time frames (TF), we see that the indicators of technical instruments on minute intervals have a sell signal due to the price rebound from the 1.1900 area. Meanwhile, hourly and daily intervals signal buying by restoring long positions by more than half relative to the downward move from September 1.
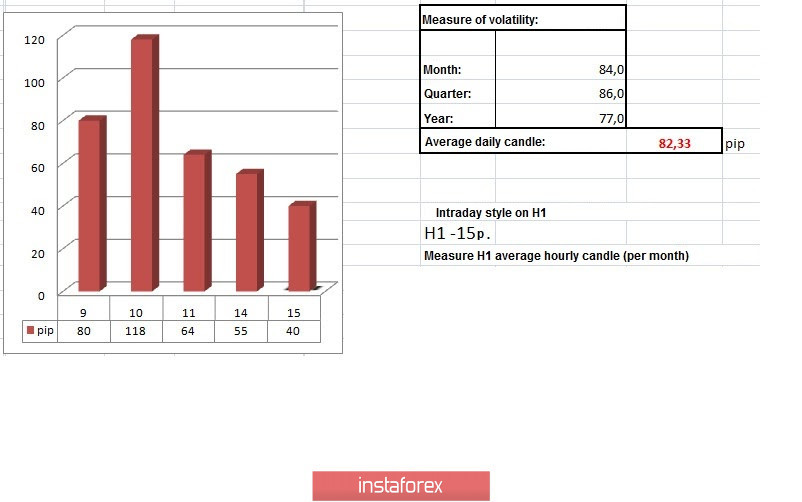
Weekly volatility / Volatility measurement: Month; Quarter; Year
The volatility measurement reflects the average daily fluctuations, calculated per Month / Quarter / Year.
(It was built considering the time of publication of the article)
The current time volatility is 40 pips, which is 51% below the average. It can be assumed that before the results of the Fed meeting, market participants will maintain a wait-and-see position, which will affect volatility.
Key levels
Resistance zones: 1.1910 **; 1.2000 ***; 1.2100 *; 1.2450 **; 1.2550; 1.2825.
Support zones: 1.1800; 1.1650 *; 1,1500; 1.1350; 1.1250 *; 1.1180 **; 1.1080; 1.1000 ***.
* Periodic level
** Range level
*** Psychological level