Analyzing Friday's trades:
GBP/USD on 30M chart
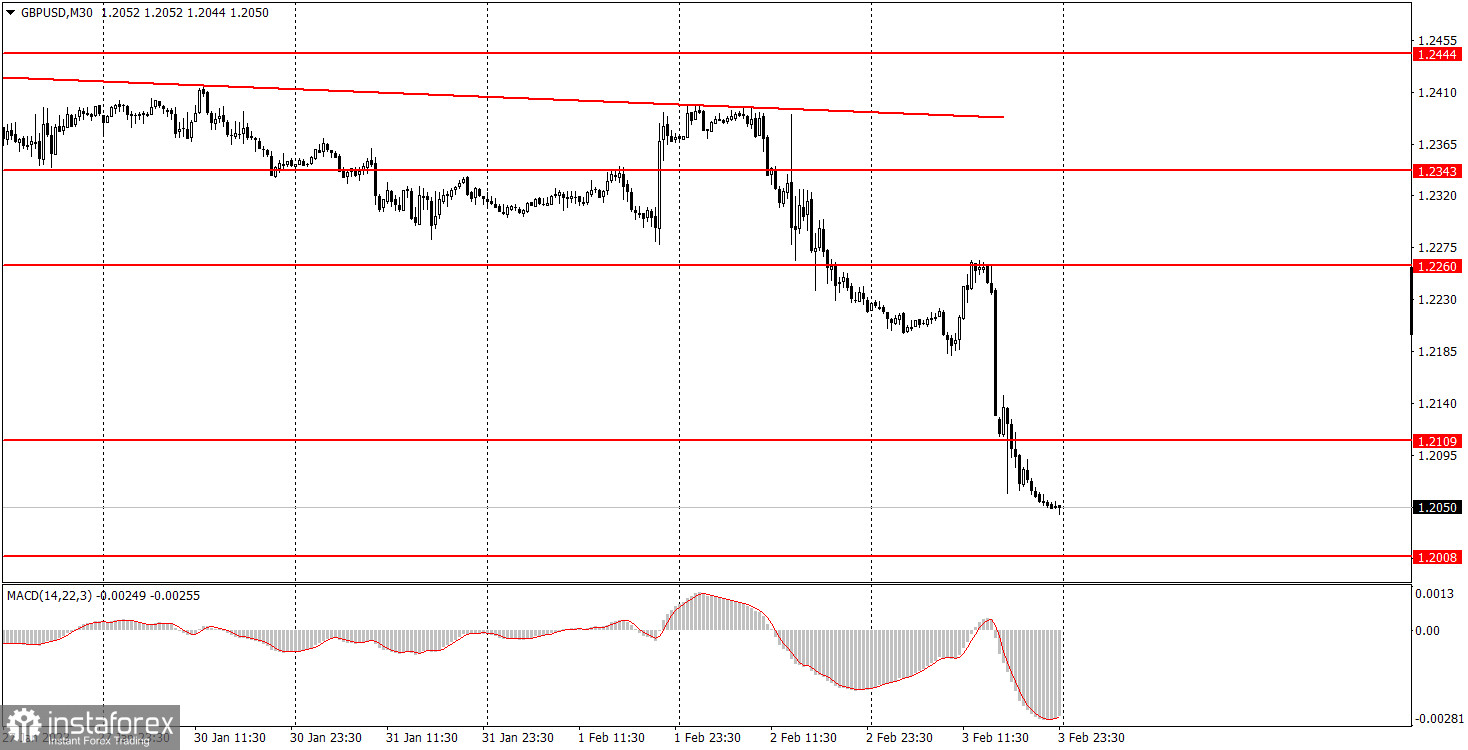
GBP/USD initially tried to correct on Friday after falling on Thursday, but after the release of US macro data, it resumed the fall. I have already discussed the US reports in our article on EUR/USD, so I won't repeat it. The only thing worth mentioning is that the US data was very strong, so the greenback could not help but grow. In general, the pair is still in a downtrend, but the trendline is weak and unconvincing. After the 2-day collapse, the pair might enter a bullish correction, but on the whole, we might expect a continuation of the downward movement in the next few weeks. The only significant event in the UK this week was the Bank of England meeting, which the market interpreted as not in favor of the pound. However, the market reacted to the rate hike beforehand, so the pair was falling on Thursday, as expected.
GBP/USD on M5 chart
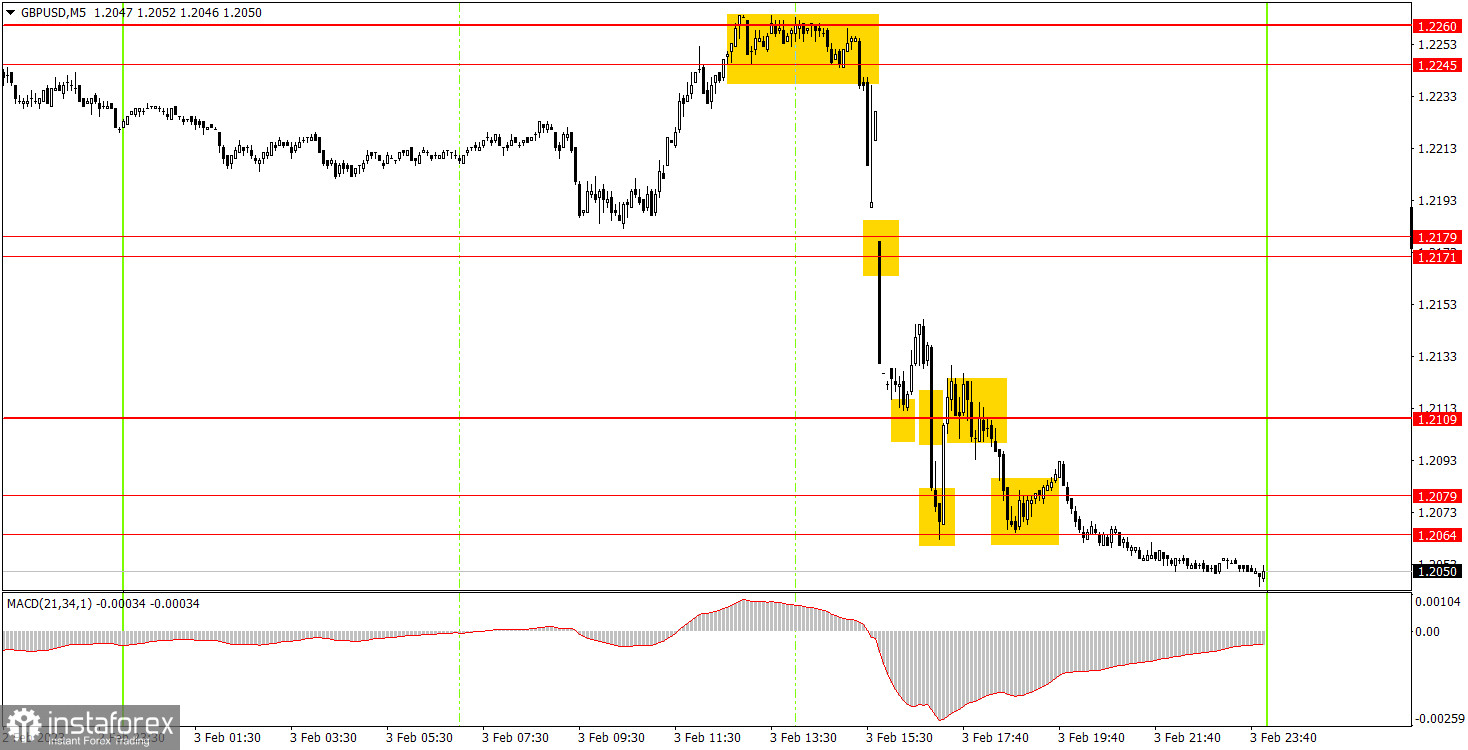
Just like it was for the euro, the movements on Friday were strong, but not every trading signal was worked out. For example, the first sell signal was formed after the release of US data. It was not advisable to open a position before the release, and the signal had not been formed yet. And it was necessary to open a position after the reports, because the pair immediately fell. If you managed to make it in time you would've gotten about 100 pips of profit, as the price fell to 1.2109. The rebound from this level was a buy signal, but it was a false one. The deal was a loss, maybe even big (about 50 pips), since the pair fell almost immediately. The next signals were formed in a limited range with many levels, so they should not work out. And it was nearing the evening, so it was not worth the risk. But in any case, you could have ended the day with a good profit.
Trading tips on Monday:
On the 30-minute chart, GBP/USD began to form a downtrend, which was fully due to the week's macroeconomic and fundamental background. Next week, the movements may be much calmer, the pair might enter a bullish correction, but in general, it should continue to fall. On the 5-minute chart, it is recommended to trade at the levels 1.1863-1.1877, 1.1950-1.1957, 1.2064-1.2079, 1.2109, 1.2171-1.2179, 1.2245-1.2260, 1.2337-1.2343. As soon as the price passes 20 pips in the right direction, you should set a Stop Loss to breakeven. On Monday, the UK will only release a report of construction PMI. Meanwhile, there's nothing to look forward to in the US. Traders will have nothing to react to during the day.
Basic rules of the trading system:
1) The strength of the signal is determined by the time it took the signal to form (a rebound or a breakout of the level). The quicker it is formed, the stronger the signal is.
2) If two or more positions were opened near a certain level based on a false signal (which did not trigger a Take Profit or test the nearest target level), then all subsequent signals at this level should be ignored.
3) When trading flat, a pair can form multiple false signals or not form them at all. In any case, it is better to stop trading at the first sign of a flat movement.
4) Trades should be opened in the period between the start of the European session and the middle of the US trading hours when all positions must be closed manually.
5) You can trade using signals from the MACD indicator on the 30-minute time frame only amid strong volatility and a clear trend that should be confirmed by a trendline or a trend channel.
6) If two levels are located too close to each other (from 5 to 15 pips), they should be considered support and resistance levels.
On the chart:
Support and Resistance levels are the levels that serve as targets when buying or selling the pair. You can place Take Profit near these levels.
Red lines are channels or trend lines that display the current trend and show in which direction it is better to trade now.
The MACD indicator (14, 22, and 3) consists of a histogram and a signal line. When they cross, this is a signal to enter the market. It is recommended to use this indicator in combination with trend patterns (channels and trendlines).
Important announcements and economic reports that can be found on the economic calendar can seriously influence the trajectory of a currency pair. Therefore, at the time of their release, we recommend trading as carefully as possible or exiting the market in order to avoid sharp price fluctuations.
Beginners on Forex should remember that not every single trade has to be profitable. The development of a clear strategy and money management is the key to success in trading over a long period of time.