Overview of trading on Friday
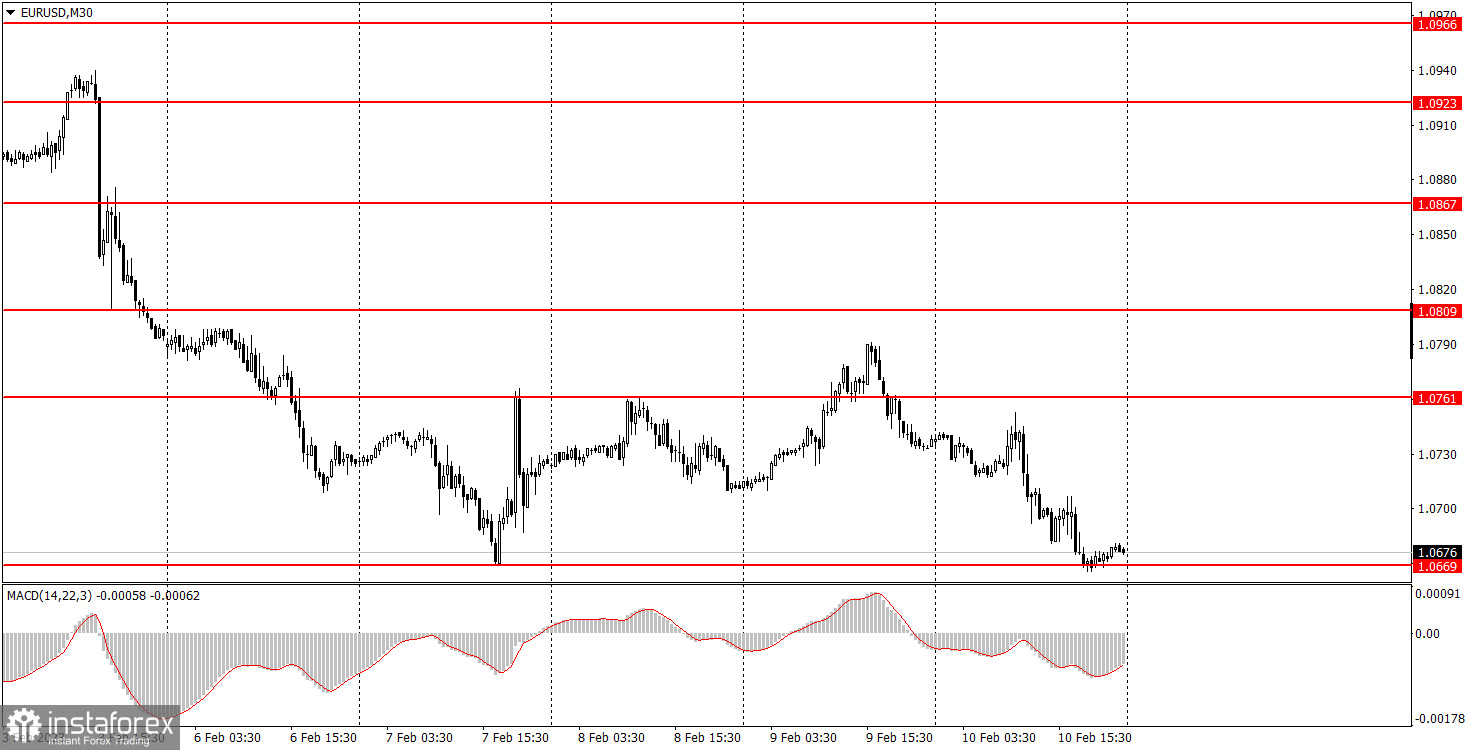
30-minute chart of EUR/USD
EUR/USD retreated to its local lows during a 5-day decline. Therefore, the odds are that the currency pair will continue its fall in the medium term. Let me remind you that we predicted exactly the same scenario for EUR/USD. So, the price has been following our forecast. The economic calendar lacked any important economic data on Friday both for the US and the EU. The only report worthy of note was the consumer confidence index by the University of Michigan. The actual reading was slightly higher than expected, albeit it was of little importance to market sentiment. Perhaps the market gave a muted response, but we are interested in stronger price moves than just 20-30 pips. To sum up, trading ideas for EUR/USD were based purely on technical analysis. The instrument is extending its down move, but the trend line or channel has not been formed yet. We expect the instrument to surpass 1.0699 on Monday or Tuesday and to decline further.
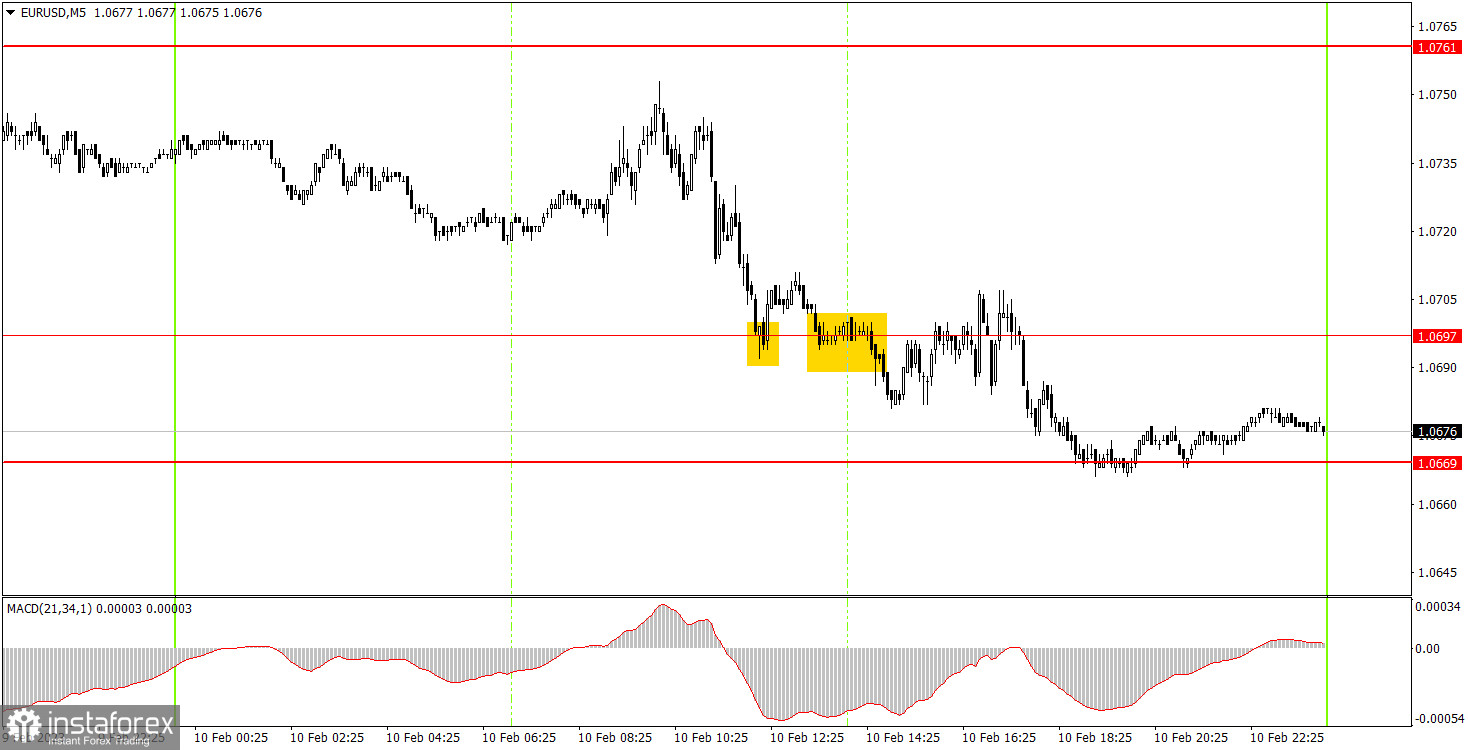
5-minute chart of EUR/USD
The currency pair traded on a seesaw and didn't follow the overall trend. Trading signals were also confusing. The instrument didn't generate an appropriate trading signal, so traders missed the most efficient section. We had to wait for a drop to 1.0697. Once reached, the price got stuck in a range. Commonly, it is always difficult to recognize good trading signals in a flat market. The price created two signals but both of them happened to be false. So, we had to stop trading the pair. Unfortunately, either in the first or in the second case, the price didn't move a mere 15 pips in the expected direction. It was enough to set a stop loss at break even. Both positions were closed with minor losses.
Trading tips for Monday
On the 30-minute chart, the currency pair quickly completed an upward correction and retreated back to 1.0669. A bounce from this level might trigger a new correctional move. Still, we expect the price to pass this level downward and carry on with its fall because the single European currency is strongly overbought.
We should consider the following levels on the 5-minute chart tomorrow: 1.0535, 1.0587-1.0607, 1.0669, 1.0697, 1.0761, 1.0809, and 1.0857-1.0867. After the price passes 15 pips in the right direction, we can place a stop loss at break even. No significant events are scheduled for tomorrow both in the US and the EU. Thus, EUR/USD is set to trade with low volatility making sluggish moves. Be aware that the US inflation report will be on tap on Tuesday which could set the market in motion.
Basic rules of the trading system:
1) The strength of the signal is determined by the time it took the signal to form (a rebound or a breakout of the level). The quicker it is formed, the stronger the signal is.
2) If two or more positions were opened near a certain level based on a false signal (which did not trigger a Take Profit or test the nearest target level), then all subsequent signals at this level should be ignored.
3) When trading flat, a pair can form multiple false signals or not form them at all. In any case, it is better to stop trading at the first sign of a flat movement.
4) Trades should be opened in the period between the start of the European session and the middle of the US trading hours when all positions must be closed manually.
5) You can trade using signals from the MACD indicator on the 30-minute time frame only amid strong volatility and a clear trend that should be confirmed by a trendline or a trend channel.
6) If two levels are located too close to each other (from 5 to 15 pips), they should be considered support and resistance levels.
On the chart:
Support and Resistance levels are the levels that serve as targets when buying or selling the pair. You can place Take Profit near these levels.
Red lines are channels or trend lines that display the current trend and show in which direction it is better to trade now.
The MACD indicator (14, 22, and 3) consists of a histogram and a signal line. When they cross, this is a signal to enter the market. It is recommended to use this indicator in combination with trend patterns (channels and trendlines).
Important announcements and economic reports that can be found on the economic calendar can seriously influence the trajectory of a currency pair. Therefore, at the time of their release, we recommend trading as carefully as possible or exiting the market in order to avoid sharp price fluctuations.
Beginners on Forex should remember that not every single trade has to be profitable. The development of a clear strategy and money management is the key to success in trading over a long period of time.