Analisis Urus Niaga untuk Khamis:
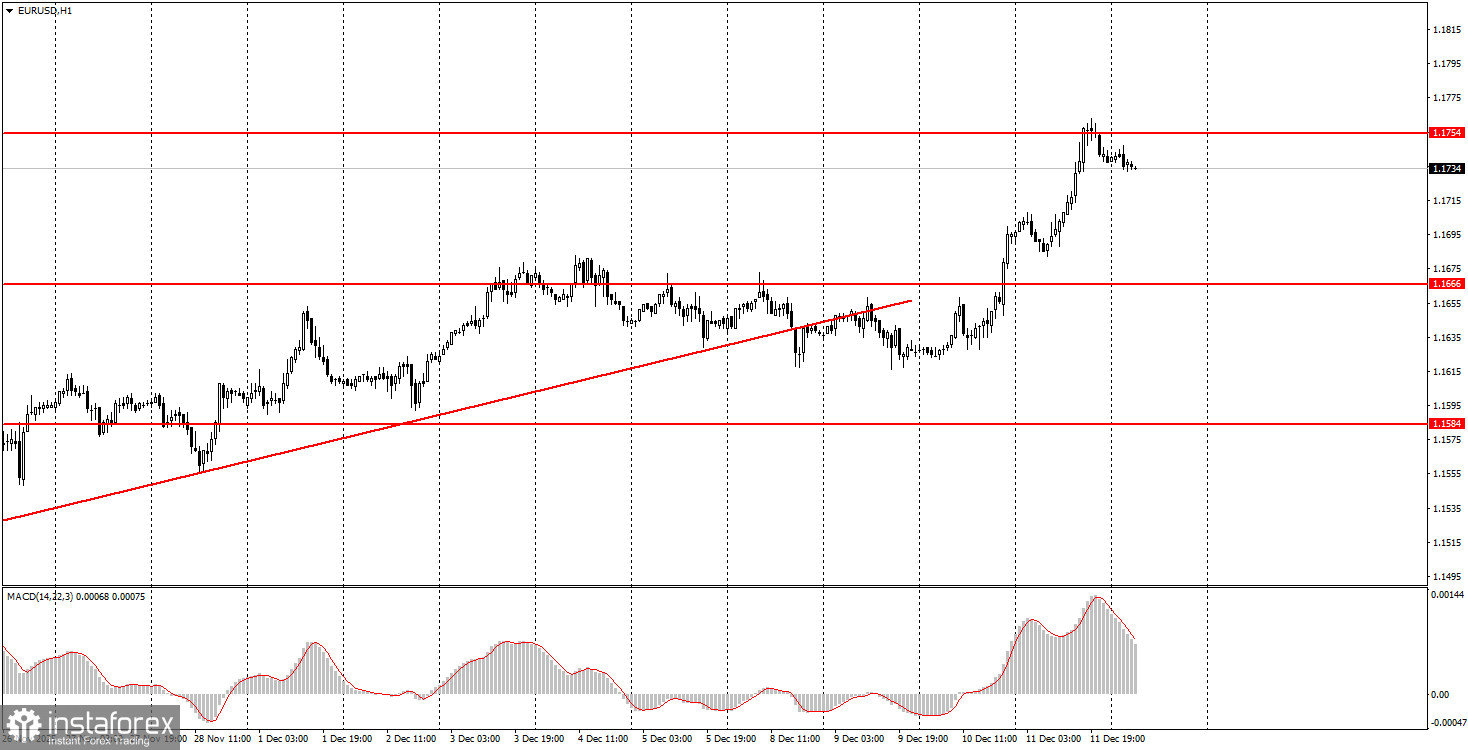
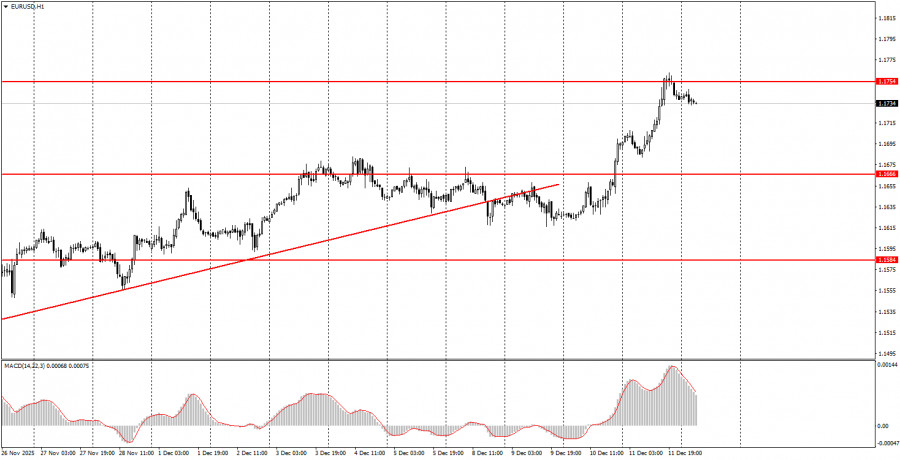
Carta 1 Jam untuk EUR/USD
Pada hari Khamis, pasangan mata wang EUR/USD meneruskan pergerakan menaiknya selepas mesyuarat Rizab Persekutuan pada malam Rabu. Perlu diingatkan bahawa hasil daripada mesyuarat Fed terakhir tahun ini tidak boleh dianggap secara jelas "pelonggaran", kerana bank pusat menurunkan kadar tetapi pada dasarnya mengumumkan penangguhan seketika yang berpanjangan untuk tahun hadapan. Hanya satu kelonggaran dasar monetari yang dirancang untuk seluruh tahun depan, yang merupakan berita baik untuk dolar. Namun, kali ini pasaran berdagang seolah-olah Fed mengumumkan rancangan untuk 4-5 penurunan lagi. Perlu juga diperhatikan bahawa dua mesyuarat Fed terakhir berakhir dengan penurunan kadar, selepas itu dolar meningkat. Oleh itu, penurunan semasa mata wang Amerika lebih berkaitan dengan aliran mendatar pada carta masa harian. Harga berpusing berhampiran sempadan bawah saluran mendatar pada 1.1400-1.1830, jadi jangkaan kenaikan ke sempadan atas boleh dijangkakan tanpa mesyuarat Fed. Dalam jangka panjang, kami menjangkakan kesinambungan aliran global 2025, dengan penembusan paras 1.1800 dan pertumbuhan selanjutnya.
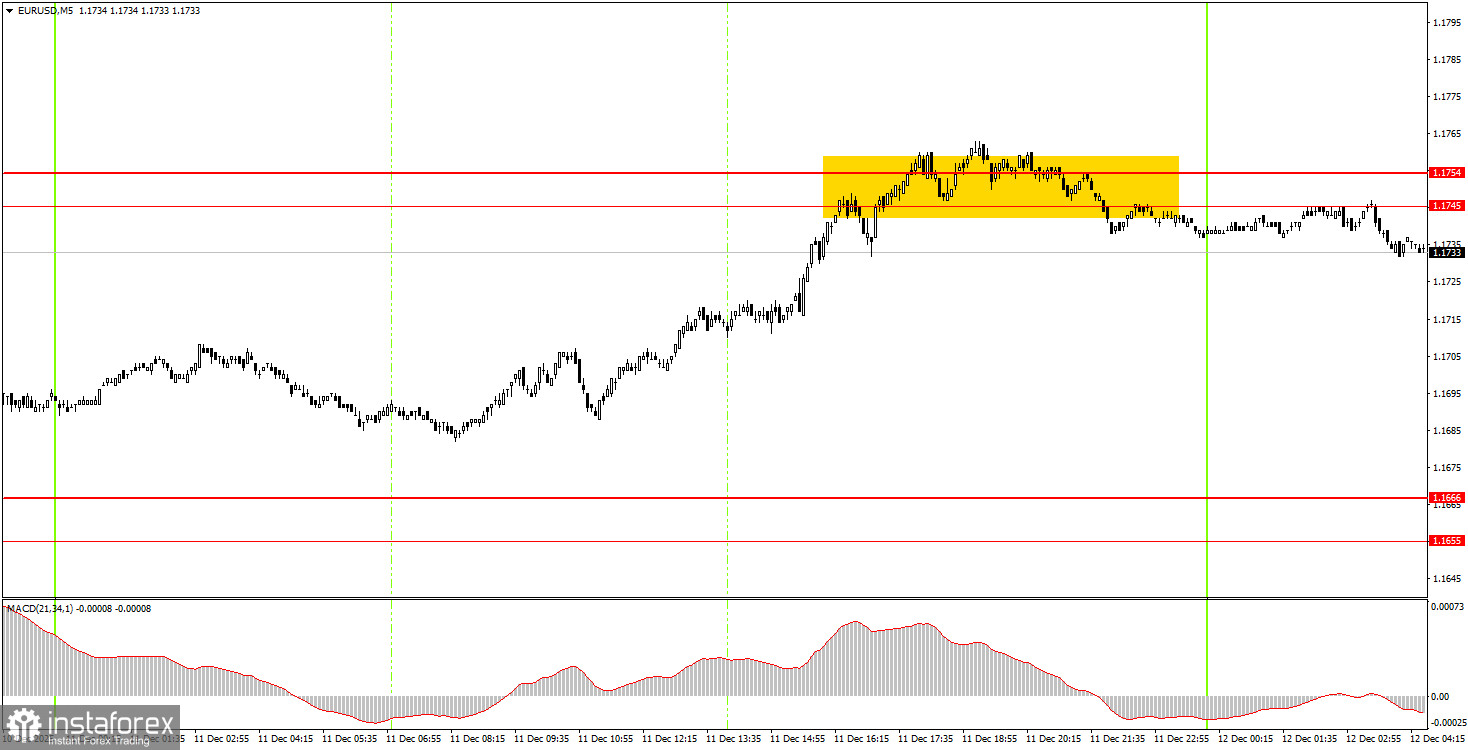
Carta 5-Minit untuk EUR/USD
Pada carta masa 5 minit, isyarat dagangan pertama terbentuk semasa sesi dagangan AS semalam. Harga mencapai kawasan rintangan 1.1745-1.1754 tetapi tidak dapat meneruskan kenaikan. Menjelang pagi Jumaat, harga telah melonjak dari kawasan ini. Isyarat beli sebelum ini terbentuk pada petang Rabu. Pedagang yang membuka kedudukan panjang berdasarkan isyarat ini berjaya memperoleh keuntungan sekitar 60 pip.
Bagaimanakah Berdagang pada Hari Jumaat:
Pada carta masa satu jam, pasangan EUR/USD terus menunjukkan arah aliran menaik, walaupun harga telah menembusi garisan arah aliran minggu ini. Latar belakang asas dan makroekonomi keseluruhan kekal sangat lemah untuk dolar AS; justeru, kami menjangkakan pertumbuhan selanjutnya. Faktor teknikal juga kini menyokong euro, kerana arah aliran mendatar pada carta masa harian masih berterusan, dan setelah berputar berhampiran sempadan bawah, adalah munasabah untuk menjangkakan pertumbuhan ke arah sempadan atas.
Pada hari Jumaat, pedagang pemula boleh berdagang dari kawasan 1.1745-1.1754. Lantunan harga dari kawasan ini akan membolehkan pembukaan kedudukan pendek dengan sasaran pada 1.1655-1.1666. Penetapan harga di atas paras ini akan memberi isyarat kedudukan panjang, dengan sasaran pada 1.1808.
Pada carta masa 5 minit, tahap yang perlu dipertimbangkan termasuk 1.1354-1.1363, 1.1413, 1.1455-1.1474, 1.1527-1.1531, 1.1550, 1.1584-1.1591, 1.1655-1.1666, 1.1745-1.1754, 1.1808, 1.1851, 1.1908, 1.1970-1.1988. Pada hari Jumaat, tiada acara penting atau laporan yang dijadualkan dalam Zon Euro dan AS. Hanya anggaran kedua inflasi bulan November akan dikeluarkan di Jerman. Oleh itu, volatiliti hari ini mungkin menurun ke tahap minimum, dan dagangan perlu dilakukan berdasarkan analisis teknikal.
Peraturan Utama Sistem Dagangan:
- Kekuatan isyarat ditentukan oleh masa yang diambil untuk membentuk isyarat (lantunan atau penembusan). Lebih kurang masa diperlukan, lebih kuat isyarat tersebut.
- Jika dua atau lebih dagangan dibuka berhampiran mana-mana paras berdasarkan isyarat palsu, semua isyarat berikutnya dari paras itu harus diabaikan.
- Dalam keadaan mendatar, mana-mana pasangan boleh membentuk banyak isyarat palsu atau tiada langsung. Pada tanda-tanda awal mendatar, lebih baik berhenti berdagang.
- Dagangan dibuka dalam tempoh antara permulaan sesi Eropah dan tengah sesi Amerika, selepas itu semua dagangan harus ditutup secara manual.
- Pada carta masa satu jam, lebih baik berdagang hanya apabila terdapat volatiliti yang baik dan arah aliran yang disahkan oleh garisan arah aliran atau saluran, menggunakan isyarat dari penunjuk MACD.
- Jika dua tahap terlalu dekat antara satu sama lain (5 hingga 20 pip), ia harus dilihat sebagai kawasan sokongan atau rintangan.
- Apabila bergerak 15 pip ke arah yang betul, tetapkan Henti Rugi (SL) ke tahap pulang modal.
Penerangan Carta:
- Tahap Sokongan dan Rintangan: Tahap yang berfungsi sebagai sasaran untuk membuka beli atau jual. Paras Ambil Untung (TP) boleh diletakkan berhampiran dengannya.
- Garisan Merah: Saluran atau garisan arah aliran yang mencerminkan arah aliran semasa dan menunjukkan arah pilihan untuk berdagang.
- Penunjuk MACD (14, 22, 3): Histogram dan garis isyarat; penunjuk tambahan yang juga boleh digunakan sebagai sumber isyarat.
Nota Penting: Ucapan dan laporan penting (sentiasa disertakan dalam kalendar berita) boleh memberi pengaruh besar terhadap pergerakan pasangan mata wang. Oleh itu, semasa pelepasannya, adalah dinasihatkan untuk berdagang dengan lebih berhati-hati atau keluar dari pasaran untuk mengelakkan pembalikan tajam yang bertentangan dengan pergerakan sebelumnya.
Sila ambil perhatian: Bagi pedagang yang berdagang di pasaran Forex, adalah penting untuk memahami bahawa tidak setiap dagangan boleh menguntungkan. Membangunkan strategi yang jelas dan mengamalkan pengurusan wang adalah kunci kepada kejayaan dagangan jangka panjang.