empty
 
 
17.11.2026 08:59 AM
Liquidations of $2bn Were Not the Bottom

Bitcoin is hovering around $64,500 after falling to $62,000 over the weekend, and I consider this bounce a false move. In my view, the bear market isn't over yet, and the nearest decline target lies in the $50,000–$59,000 range. All the signs I rely on point in one direction.

This image is no longer relevant

The main technical argument is the break below the 200-week moving average at about $68,000. In past bear markets, price often found its cycle bottom near that line, so I view a move below it as confirmation of weakness rather than a random poke. Notably, in early summer the low near $58,500 seemed to many like a reversal point, and now the price has again approached those levels with nothing to support it.

Money is leaving, not coming. About $1.9bn has flowed out of bitcoin ETFs net since the start of 2026, while $21bn entered them in all of 2025. Stablecoin supply has declined by $14–16bn over the last 30 days and fell to roughly $280bn — a level not seen since September 2025. This directly signals that fresh capital is not entering the market, and any rally now lacks fuel.

I do not regard massive liquidations as a sign of a bottom. Over the weekend, more than $2bn left the market in a single day, but the bounce from $62,000 was driven by short-covering rather than the arrival of new buyers. On November 3, when bitcoin traded around $80,500, confident claims were made that the bottom was in, and since then the price has lost about 20%. Bonds add pressure: the 10-year Treasury yield rose above 5.1%, the market is almost fully pricing a December Federal Reserve hike, and in such an environment bitcoin — which pays no interest — loses out to bonds.

Ether around $1,800 has already lost about 38% year-to-date, but without new inflows I see no reason for it to outperform on a rebound. The coming days add risk: Nvidia's report on November 17 and Anthropic's IPO on November 18–19 could intensify the sell-off in risk assets. Those who draw analogies with SpaceX overlook that back then bitcoin fell another 18 days after trading began and found a bottom only in late June.

My base scenario is this: first, bitcoin will retest $62,000 and $60,000, after which a decline to the $50,000–$59,000 range is likely, where I see no meaningful support because price passed that zone quickly during the 2024 rally. I will become less cautious only when the price returns above $68,000 and new capital begins flowing into funds.

On Bitcoin

This image is no longer relevant

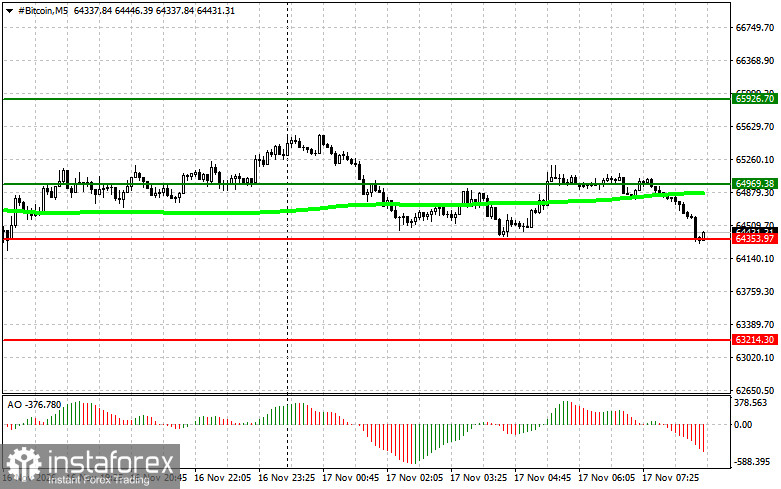
The nearest range for Bitcoin is between $64,300 and $64,900, and the plan centers on two mirror directions with a full set of breakout and bounce scenarios. If price decisively consolidates above $64,900, provided it is above the 50-day moving average and the Awesome Oscillator is above zero, I consider buy positions targeting $65,900, where profits should be taken, and watch for a short on the pullback. If a break below $64,300 proves to be a false spike and price returns to the range, long positions also work—first targeting the upper boundary at $64,900 and then $65,900.

The selling side is symmetric. A confirmed break below $64,300, provided the 50-day MA is above price and the Awesome Oscillator is below zero, opens the way for a short targeting $63,200. If a break above $64,900 fails to confirm and price reverses, short positions are also acceptable—initially targeting a return to $64,300 and then $63,200.

On Ether

This image is no longer relevant

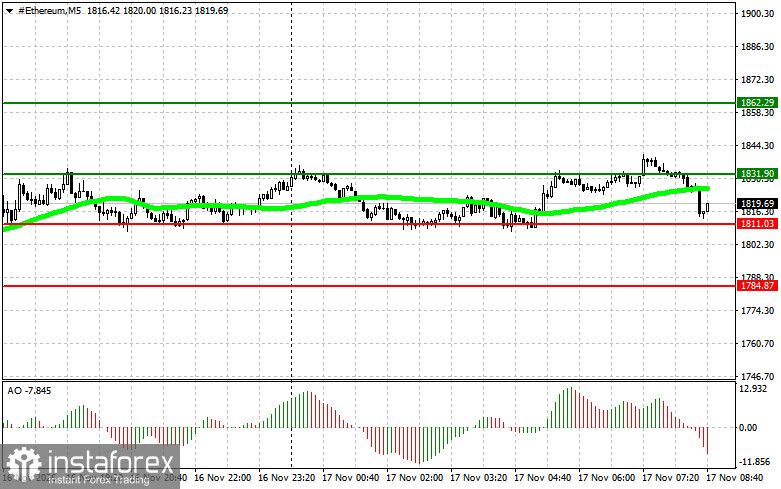
The logic mirrors bitcoin's on its own price scale. The nearest range is between $1,801 and $1,831. A confirmed consolidation above $1,831, provided price is above the 50-day MA and the Awesome Oscillator is above zero, gives buys with a target of $1,862; a bounce off $1,801 without a confirmed break lower gives buys first to $1,831, then to $1,862. A confirmed break below $1,801, provided the MA is above price and the Awesome Oscillator is below zero, opens a short to $1,784, and a rejection at $1,831 without a confirmed breakout higher also leads to shorts, first to $1,801 and then to $1,784. Both indicators serve as filters to weed out false moves rather than standalone entry signals, and decisions are made only after the price actually confirms the specified levels.

EUR
Ringkasan
Neutral
Segera
1 hari
Analitic
Maxim Magdalinin
Mulakan perdagangan
Jana pendapatan melalui perubahan kadar mata wang kripto dengan InstaForex.
Muat turun MetaTrader 4 dan buka dagangan pertama anda.
  • Grand Choice
    Contest by
    InstaForex
    InstaForex always strives to help you
    fulfill your biggest dreams.
    SERTAI PERADUAN
  • Chancy Deposit
    Deposit akaun anda sebanyak $3,000 dan dapatkan $5000 lebih lagi!
    Dalam November kami membuat cabutan bertuah $5000 dalam Kempen Chancy Deposit!
    Dapatkan peluang untuk menang dengan membuat deposit $ 3000 ke dalam akaun dagangan. Setelah memenuhi syarat ini, anda menjadi peserta kempen.
    SERTAI PERADUAN
  • Trade Wise, Win Device
    Daftar untuk peraduan dan tambah dana akaun anda dengan sekurang-kurangnya AS$ 500 untuk layak memenangi peranti mudah alih.
    SERTAI PERADUAN
  • Bonus 30%
    Dapatkan bonus 30% setiap kali anda membuat penambahan dana akaun anda
    DAPATKAN BONUS

Artikel yang dicadangkan

Tidak boleh bertanya sekarang?
Tanya soalan anda di Ruangan bersembang.
Panggilan semula Widget