4-hour timeframe
Amplitude of the last 5 days (high-low): 39p - 55p - 37p - 64p - 62p.
Average volatility over the past 5 days: 51p (average).
The first trading day of the week passed, as is often the case, in quiet corrective trading. The EUR/USD currency pair has been adjusting all day to the Kijun-sen critical line, which it has not yet worked out at the moment. Thus, the volatility on Monday, October 14, leaves much to be desired. On the other hand, what can traders expect on a day when no important macroeconomic publications were planned either in the US or in the European Union? A single report on industrial production in the eurozone in August showed an even greater drop in the indicator than was recorded months earlier and than predicted by the forecast values. -2.8% y/y. Strange, but in monthly terms, an increase of 0.4% was recorded. However, all traders are well aware that now industrial production in the EU is in decline. For several months now, absolutely failed indicators of business activity in the manufacturing sector have been indicating this. Thus, a reduction in industrial production was expected.
Meanwhile, traders still need to resolve the question: is there any reason to continue buying the European currency? In recent weeks, the euro has slightly rebounded against the dollar, but we have repeatedly said that the fundamental reasons for this growth are not too many, and most of the fundamental factors came not from the EU, but from the United States. That is, the euro is growing on the negative from the United States, and not on the positive from Europe. From our point of view, there are no reasons for new purchases. We have several times listed the advantages of the US dollar over the euro and the US economy over the eurozone economy. Since then, nothing has changed in the balance of power. Latest news that the United States and China have advanced very much in the negotiations on a trade agreement are again playing for the US dollar. In theory, the end of the US-Chinese conflict will be in the hands of the US economy and, accordingly, the US dollar. And although traders did not particularly react to any news about the escalation of the Beijing-Washington conflict, any news that signifies a reconciliation of the parties will potentially have a positive impact on the desire of traders to invest in the dollar.
Donald Trump will have to put pressure on the Federal Reserve and Jerome Powell again, since the US president does not have other methods of influencing the dollar. The national currency is indeed under the authority of the central bank, and it is most convenient for it to manage its course. It is this management that Trump needs in order to reduce the dollar exchange rate in the foreign exchange market as much as possible, so that American goods are more competitive in world markets, and it is easier for the United States themselves to service their huge public debt. Thus, we are waiting for new criticism against the Fed. The euro's chances for further growth lies in the Fed's rate cut.
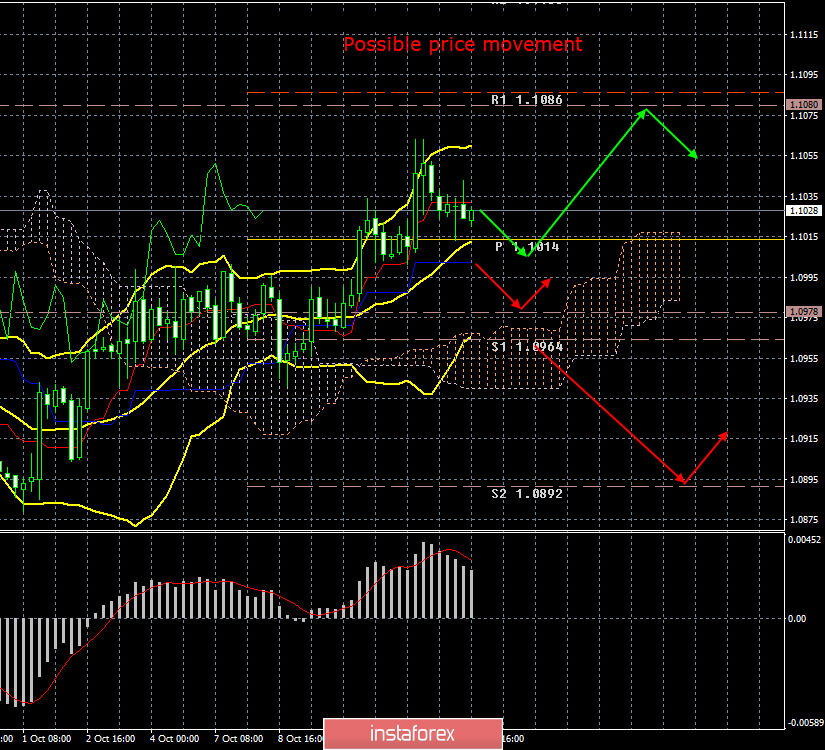
The technical picture continues to signal an upward trend. If the euro/dollar pair remains above the Kijun-sen line, then the upward movement will be able to resume tomorrow. Otherwise, traders will take a step towards the resumption of a downward trend.
Trading recommendations:
The EUR/USD pair began to adjust. Thus, it is recommended that traders now wait for the correction to complete and resume buying the euro with a target of 1.1080 if the pair remains above the critical line. It will be possible to return to US currency purchases in case of overcoming the Kijun-sen line with the first target of 1.0978.
In addition to the technical picture, fundamental data and the time of their release should also be taken into account.
Explanation of the illustration:
Ichimoku indicator:
Tenkan-sen is the red line.
Kijun-sen is the blue line.
Senkou Span A - light brown dotted line.
Senkou Span B - light purple dashed line.
Chikou Span - green line.
Bollinger Bands Indicator:
3 yellow lines.
MACD indicator:
Red line and bar graph with white bars in the indicator window.