4-hour timeframe
Technical data:
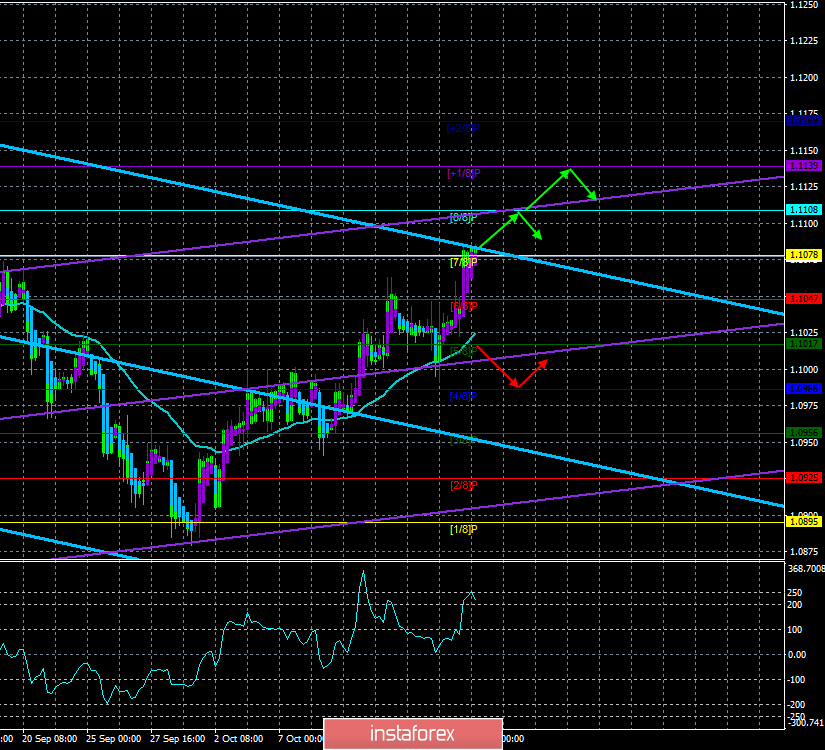
The upper channel of linear regression: direction – down.
The lower channel of linear regression: direction – upward.
The moving average (20; smoothed) – up.
CCI: 216.4959
The European currency continues, in principle, a fairly confident upward movement, which has not been with it for a long time. Yesterday, we drew the attention of traders to the market ignoring the report on the consumer price index in the European Union. From our point of view, this is a significant moment, as it may mean that the global mood of market participants has changed to an upward one. If this hypothesis is correct, then not only will the upward movement continue, it will finally be possible to count on a serious strengthening of the euro. Although it seems to us that such a scenario is still not destined to come true, as both the Fed and the ECB are now trying to intervene as often as possible in monetary policy to stimulate the economy or achieve other goals. Of course, the Federal Reserve has more room for maneuvers. Its rates remain at 2.0%, that is, the regulator has 8 more opportunities to lower the key rate. This is if we take the boundary level value of 0.0%. But the ECB has very few special tools to influence the economy. The rates are already negative, the QE program has been restarted and will begin to operate again in November 2019. What is left? More to take rates below the "waterline"? To further expand the program to stimulate the economy? It is on this basis that we believe that the Fed will now ease monetary policy at a faster pace than the European Union. And this is the salvation of the euro. This is an opportunity to achieve one of the main goals of Donald Trump – to reduce the dollar on world markets. For such a scenario, the main thing is that the Fed does not take a fundamentally different position and does not stop cutting rates. Thus, in this context, the next meeting of the Fed will be extremely important. If the regulator cuts the key rate again, for the third time in a row, it will be a great bell for the euro bulls.
Today, several macroeconomic reports will be published in the States. We are talking about applications for unemployment benefits, industrial production and the number of construction projects started. All three indicators are secondary and a particularly strong reaction to them should not be expected. More important publications are not planned for today, and in the EU today the calendar of events is generally empty. On the other hand, all the attention of traders today will be uniquely focused on the start of the European Union summit, at which the fate of Brexit will be decided.
From a technical point of view, everything is extremely simple. There is an upward trend, the price is above the moving average, the lower channel of linear regression turned up, indicating that the current trend is not a one-day trend. Therefore, it is recommended to follow the trend and trade for an increase, without trying to guess what will be the actions of the ECB and the Fed at the end of the month.
Nearest support levels:
S1 – 1.1047
S2 – 1.1017
S3 – 1.0986
Nearest resistance levels:
R1 – 1.1078
R2 – 1.1108
R3 – 1.1139
Trading recommendations:
The euro/dollar continues to move up. Thus, it is recommended to continue buying the euro currency with the targets of 1.1078 and 1.1108 until the Heiken Ashi indicator turns down. It is recommended to buy the US currency if the bears overcome the moving average line with the first targets of 1.0986 and 1.0956.
In addition to the technical picture, fundamental data and the time of their release should also be taken into account.
Explanation of the illustrations:
The upper channel of linear regression – the blue line of the unidirectional movement.
The lower channel of linear regression – the purple line of the unidirectional movement.
CCI – the blue line in the indicator window.
The moving average (20; smoothed) – blue line on the price chart.
Support and resistance – red horizontal lines.
Heiken Ashi – an indicator that colors bars in blue or purple.