Hello!
At the trading of the last five days, the US dollar showed strengthening across the spectrum of the currency market. In particular, the EUR/USD pair fell by 1.29%.
Given the October growth of the single European currency against the US dollar, it could be assumed that it will continue, but a strong decline during the first trading week of November does not justify such expectations.
As has been noted many times before, the downward movement is due to the corresponding technical picture, and the inability of the European bulls to break through the strong and significant resistance level of 1.1180 played an important role. In this case, the rate was predicted to decline with the initial targets in the support area of 1.1080-1.1060, where the further fate of the pair will be decided.
Well, let's turn to the price charts and look at the real situation that is observed on the main currency pair of the market. As usual, on Monday, after the completion of the previous weekly trading, we analyze the corresponding timeframe.
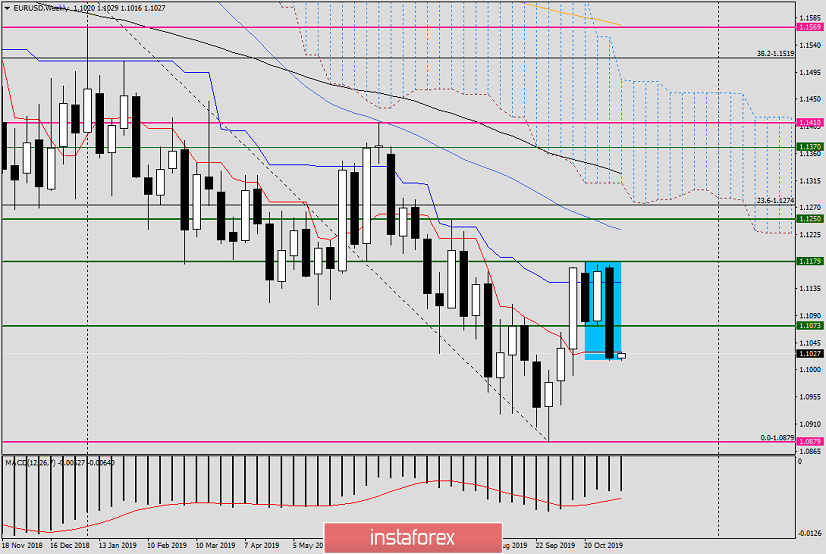
Weekly
At the end of trading on November 4-8, a large black candle appeared on the weekly chart, which absorbed the previous white one. This is a "bearish absorption", which indicates further downward prospects of the instrument.
However, after such a strong fall, it is quite possible to count on some correction of the rate, and then expect the continuation of the downward dynamics.
Judging by the weekly timeframe, a pullback to the broken support level of 1.1073 is not excluded, after which the euro/dollar pair will again fall into the "paws of the bears" and will be under selling pressure. At the same time, I would like to draw attention to the fact that it is not necessary to accurately determine the entry points on weekly, price fluctuations and highs can be significant. It is always better to look for more accurate prices for opening positions at smaller time intervals. Here, as a reference point of the probable correction, I will mark the level of 1.1073.
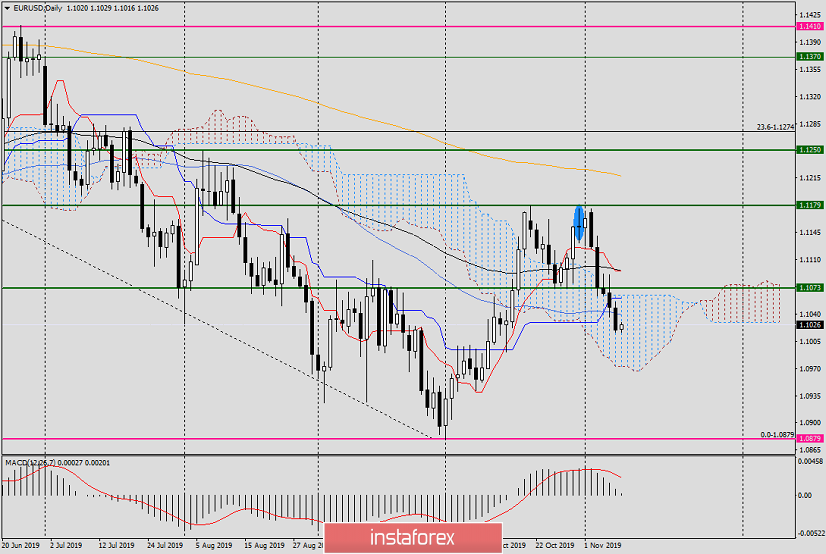
Daily
On the daily chart, we see that the highlighted candlestick pattern for October 31, "Long-Legged Doji" albeit a day later, but still led to the expected movement in the south direction.
During the decline, the pair broke through the Tenkan line of the Ichimoku indicator and the exponential moving average. After the breakdown of the support of 1.1073, the course was within the Ichimoku cloud and fell below the Kijun line and 55 MA.
Now, all the technical analysis tools passed down, as well as the broken level of 1.1073, in the case of rollbacks to them, can provide strong resistance. Why not? If you could not keep the price as a support, now, perhaps, the functions of resistance will be able to perform better.
At the time of writing, EUR/USD is showing attempts to correct the previous decline and is trading with a slight increase in the area of 1.1027. If the rise continues, its nearest targets will be: 1.1040 (55 MA), 1.1060/64 (Kijun and the upper border of the cloud), as well as the price area of 1.1091-1.1097, where the trading highs of November 6-7 are marked and Tenkan with 89 EMA is located.
Thus, after the rise to the listed targets for EUR/USD, you can consider opening sell trades, especially after the appearance of bearish candlestick signals. More accurate price targets for positioning will be considered in tomorrow's article at smaller time intervals: H4 and H1.
At the end of this article, I will highlight important macroeconomic data that this week may have an impact on trading on the main currency pair.
Eurozone: ZEW Institute business sentiment index, industrial production data, revised GDP data for the 3rd quarter, final data on the consumer price index.
US: consumer price index (CPI), the semi-annual report on monetary policy of the head of the Fed Jerome Powell, producer price index, primary applications for unemployment benefits.
It is also worth noting that there will be speeches by monetary officials of the ECB and the Fed this week.
More detailed information about these and other events can be obtained by looking at the economic calendar.
Have a nice day!