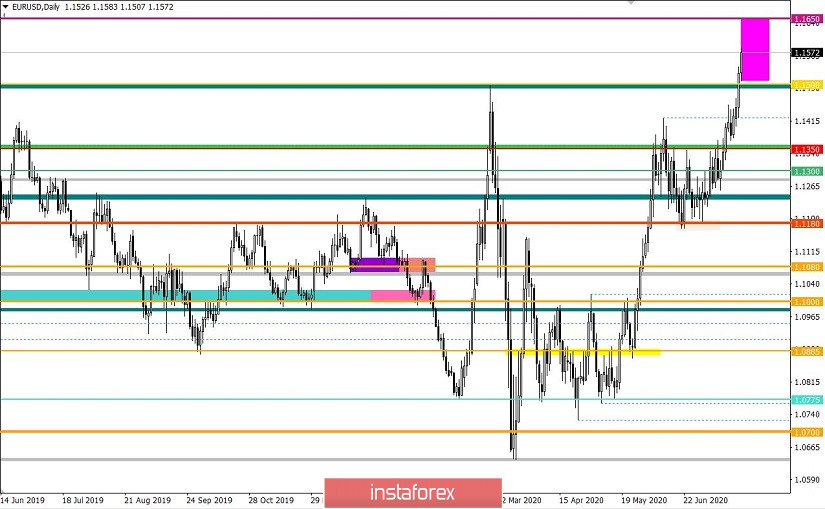
Yesterday was a triumph for the bulls as the quote managed to overcome a number of important price levels, updating the yearly high which triggered a fluctuation relative to the movement last January 2019.
It almost changed the medium-term downward trend which started last 2018, as the quote consolidated higher than 1.1500.
Thus, scrutinizing the trading chart, we can see that a round of long positions arose at the start of the American session, which confirms the speculative mood of the market, during which the European currency managed to soar above 1.1500.
In addition, as discussed in the previous review, traders worked on local operations, which triggered a breakout from range limits and gave solid profit.
It led to a volatility of 116 points, which is 50% higher than the average daily level and the highest recorded in 25 trading days.
Analyzing the trading chart in general terms (daily period), we can see an attempt to change the medium-term downtrend, where a 47% recovery was recorded. A consolidation higher than 1.1600 will indicate more than 50% of recovery, which signals a change in the trend.
As for news, the reports published yesterday included the results of the EU summit, during which members of the European Union adopted a stimulus plan that will help tackle the impact of the coronavirus pandemic. For these purposes, € 750 billion has been allocated, of which $ 390 billion will become grants for various medical measures such as prevention and purchase of vaccines and medical equipment, while the remaining € 360 billion will be low-interest loans, which can be used for a wider range of needs, including social ones.
Taking into account the EU budget for the next seven years, the total volume of the aid plan will amount to € 1.8 trillion.
With regards to the United States, the country continues its fight against the coronavirus, but the available measures are clearly insufficient if President Donald Trump allows the situation to worsen.
"Unfortunately, it will probably get worse at first before it gets better. I hate to say it, but that's the way it is. Look at the whole world, it's all over. This is the trend," US President Donald Trump said.
In turn, ECB Vice President Luis de Guindos warns of the emergence of a second wave of coronavirus in the United States, as well as in Latin America and parts of Asia.
"This will have a negative impact on the development of world trade. The ECB expects global trade to contract by more than -10% in 2020," he said.
Today, data on the secondary housing market of the United States will be published, where there are by no means bad indicators that can support the US dollar. The index could grow by 23%, from 3.91 million to 4.70 million, which may look like one of the most impressive leaps recorded. Given the overheating of long positions, this data may well be enough for a correction.
Further development
Analyzing the current trading chart, we can see the high activity of speculators, which raised the rate of the European currency. If these continue to persist, the euro will be overheated, which could result to a sharp reversal in the market. Nevertheless, the quote is heading towards the range 1.1600-1.1650, where stops are likely to be triggered, and correction is considered in values 1.1450-1.1400-1.1350
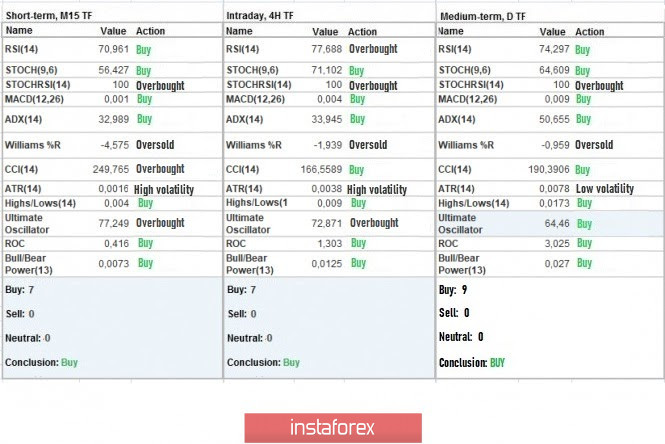
Indicator analysis
Analyzing the different sectors of time frames (TF), we can see that the indicators of technical instruments in the minute, hourly and daily periods signal "buy" due to the rapid move and consolidation at the highs of the current year.
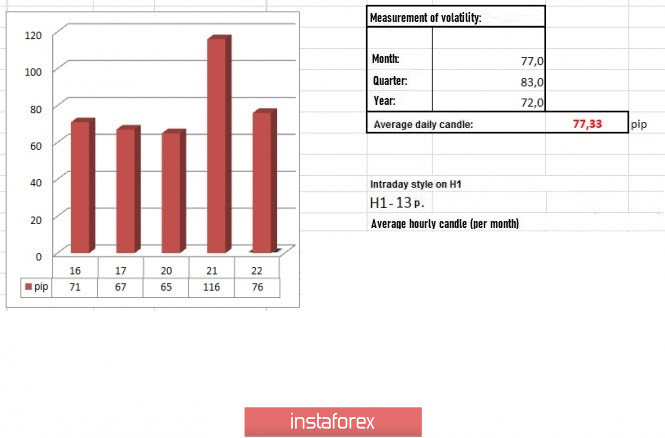
Weekly volatility / Volatility measurement: Month; Quarter; Year
The measurement of volatility reflects the average daily fluctuation calculated by Month / Quarter / Year.
(July 22 was built, taking into account the time the article is published)
The volatility of the current time is 76 points, which is in proportion with the average daily value. If speculative mood persists in the market, volatility will continue to increase.
Key levels
Resistance zones: 1.1650 *; 1.1720 **; 1.1850 **; 1.2100
Support Zones: 1,1500 1.1350; 1.1250 *; 1.1.180 **; 1.1080; 1.1000 ***; 1.0850 **; 1.0775 *; 1.0650 (1.0636); 1.0500 ***; 1.0350 **; 1.0000 ***.
* Periodic level
** Range level
*** Psychological level
Also check the hot forecast and trading recommendation for the GBP/USD pair here, or the brief trading recommendations for both the EUR/USD, GBP/USD and USD/JPY pairs here.