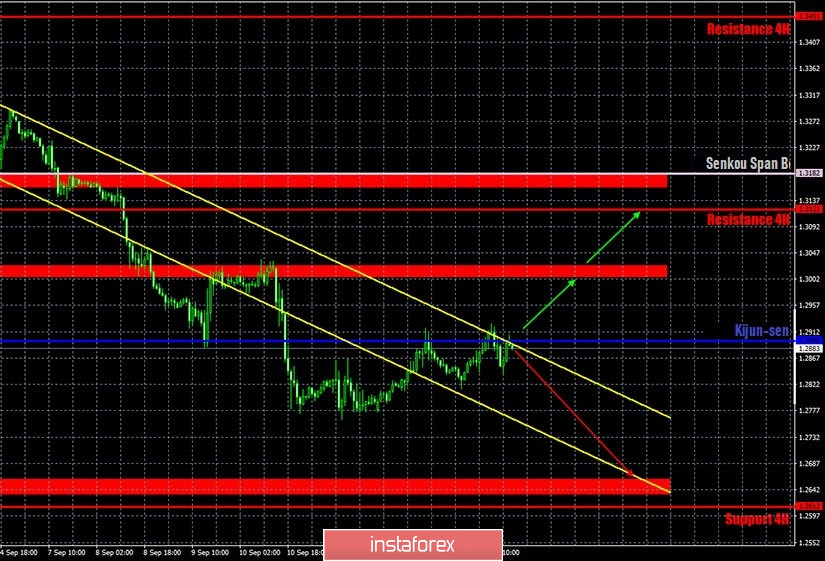
EUR/USD 1H
The euro/dollar pair once again rose to the upper border of the sideways channel of 1.17-1.19 on the hourly timeframe on September 15, and at the same time, it also climbed to the Senkou Span B line and the resistance area of 1.1886-1.1910. The pair's quotes rebounded from all three resistances, which showed and proved that buyers do not yet see reasons and grounds for further longs of the euro. Thus, at the moment, everything looks as if the downward movement will resume within the area of the lower line of the side channel. The support level of 1.1760 will be the intermediate target. We believe that it is possible to expect the upward movement to continue, but first the 1.1886-1.1910 area must be overcome. But even in this case, the upward movement might not be strong.
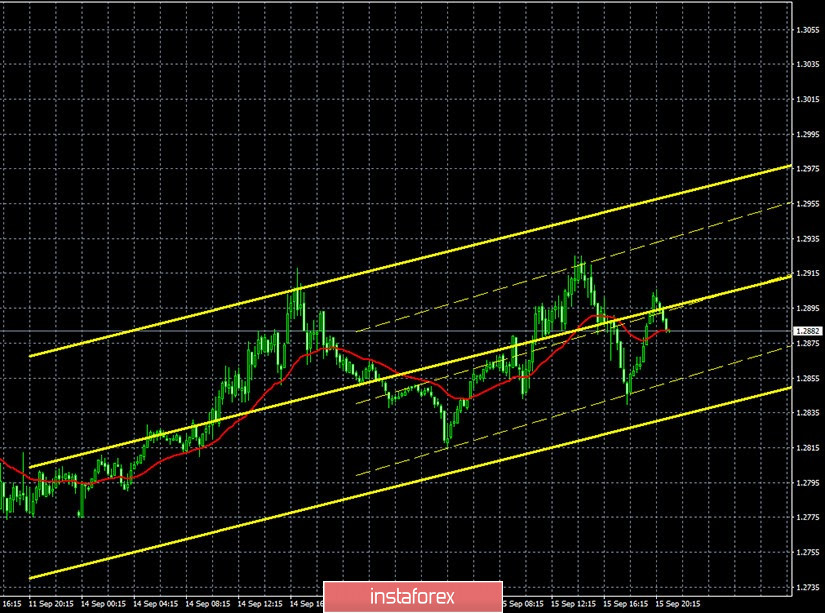
EUR/USD 15M

The lower linear regression channel began to move down on the 15-minute timeframe, as the price failed to overcome the 1.1900 level again. The latest Commitment of Reports (COT) report, which, I recall, comes out with a three-day delay and only covers the dates of September 2-8, turned out to be absolutely predictable. We expected that it wouldn't show any fundamental changes in the mood of large traders, because the EUR/USD pair continues to trade in a side channel. At the end of the reporting week, the category of non-commercial traders closed 3,073 Buy-contracts (longs) and opened 789 Sell-contracts (shorts). The changes are minimal considering that the total number of contracts for this category exceeds 300,000. We can only note that the net position for players in this category has slightly decreased, which means a weakening of the bullish sentiment, but again minimal. The commercial trader category was much more active and closed as many as 30,000 contracts during the reporting week. However, we remind you that the actions of non-commercial traders are the most important, since they are considered to be the ones driving the market, and commercial traders usually open positions opposite to them. The last three trading days of last week were not included in the latest COT report, however, no serious price changes were recorded on those days.
The United States released a report on industrial production for July on Tuesday, September 15, which did not particularly impress traders and there was no reaction to it. But a relatively important report on retail sales will be published today, and we can expect the results of the two-day Federal Reserve meeting late in the evening. As we mentioned, the Fed is unlikely to change any parameters of monetary policy, so the main focus is on Chairman Jerome Powell's speech and the accompanying Fed statement. Potentially, these events are of great importance, but if Powell does not report anything interesting, then it is unlikely for traders to have significant reactions. The meeting may well turn out to be a "walk-through". At the same time, traders may start to play ahead of the curve today, which means that active trading will begin much earlier than upon receiving information from the Fed. Therefore, in any case, you need to trade quite carefully today.
We have two trading ideas for September 16:
1) Bulls, in their desire to resume the upward trend, stayed on the upper line of the side channel, as well as several resistances that prevented them from continuing to grow. Therefore, we recommend to consider new long positions only if the 1.1884-1.1910 area has been overcome, and then you can aim for the resistance level of 1.2003. Take Profit in this case will be about 60 points.
2) Bears received a new opportunity to pull down the euro/dollar pair to the lower area of the side channel of 1.17-1.19, since the 1.1884-1.1910 area was not overcome, but a rebound was made from the Senkou Span B line. Thus, we recommend you to wait until one settles below the Kijun-sen line (1.1848) and then you can start trading down while aiming for the support level of 1.1760. Potential Take Profit in this case is about 70 points.
Explanations for illustrations:
Support and Resistance Levels are the levels that serve as targets when buying or selling the pair. You can place Take Profit near these levels.
Kijun-sen and Senkou Span B lines are lines of the Ichimoku indicator transferred to the hourly timeframe from the 4-hour one.
Support and resistance areas are areas from which the price has repeatedly rebounded off.
Yellow lines are trend lines, trend channels and any other technical patterns.