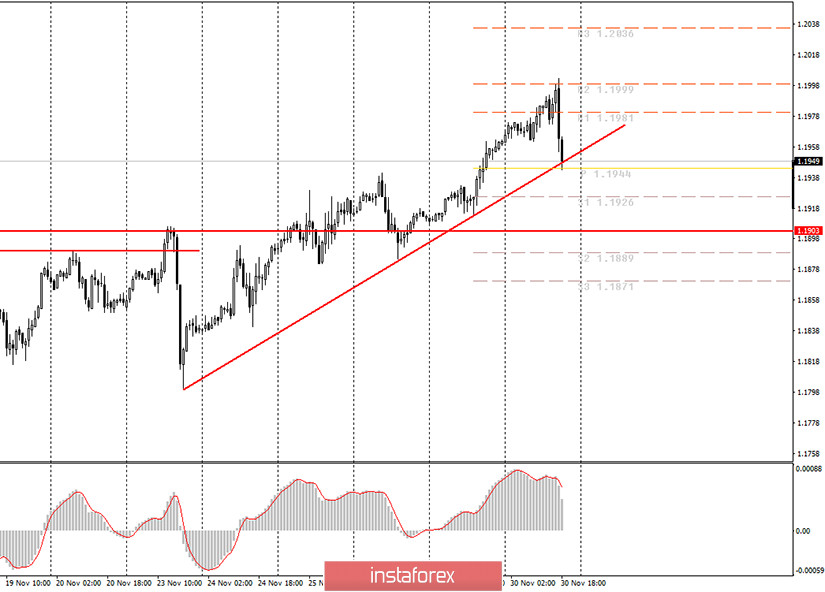
EUR/USD hourly chart

On Monday session, the EUR/USD pair continued its upward movement. By the end of the day, it finally tested the 1.2000 level (1.2003 to be precise). Thus, the pair has tested the psychologically important level for the second time in 2020. Just like the first time, there was a sharp pullback to the downside after the price had tested this level. At the first stage of the downtrend, the pair tested the ascending trendline. In theory, the EUR/USD pair can still pull back from this line and continue its uptrend. However, we have been waiting for a strong downward movement for several weeks. Therefore, we expect the price to pass the trendline and keep on moving lower at least to the level of 1.1700. If the price breaks through the trend line, it will then reverse to the downside, thus making short positions relevant again. However, we would like to remind novice traders that they need to be cautious as they can incur serious losses due to the lack of trading experience. Therefore, we believe that you should wait until the first round of the downtrend is completed. Then, after the upward correction starts, you can look for selling opportunities.
In the EU, head of the European Central Bank Christine Lagarde gave speech on Monday. At the same time, no important macroeconomic events happened in the US. However, traders did not get any new hints from the ECB. Christine Lagarde spoke about the digital euro and stablecoins but did not mention anything about the monetary policy or the future of the European economy. Thus, the fundamental background was neutral today. Therefore, the pair's drop in the afternoon trade can be attributed to purely technical reasons, that is, to a rebound from the important level of 1.2000.
On Tuesday, the first day of winter, markets anticipate a number of important economic reports. First, the EU will publish the manufacturing PMI. The indicator will show whether the industry has suffered from the second COVID-19 wave and the subsequent lockdowns. Secondly, inflation data in the EU for November (preliminary estimates) is due to be published on Tuesday. Analysts expect it to stay negative at the level of -0.2% on a yearly basis. This will definitely dampen the optimism of the euro bulls. What is more, Fed Chairman Jerome Powell will give testimony in the US Congress. This event is always highly anticipated by market participants. Finally, Christine Lagarde will make another statement tomorrow. In addition, the ISM and Markit manufacturing PMI data in the US will be released on Tuesday. We expect to see active trading tomorrow given the eventful economic calendar. This also means that the EUR/USD pair can change its direction several times during the day.
Possible scenarios for December 1
1) Long positions on the pair are still relevant as the price is holding above the ascending trendline. To open new long positions, you need to wait until the price rebounds from the trendline. In this case, we recommend going long with the upward targets at 1.1981 and 1.1999, even without a buy signal from the MACD indicator as it can give a delayed reaction.
2) Selling the pair is not the best option now. It is only possible if the price consolidates below the trendline, which will lead to a change in the short-term trend. But even in this case, novice traders are advised to wait for the downtrend to complete its first round, the round of correction. Then, they can start looking for signals to sell the pair with the targets at 1.1926 and 1.1889.
On the chart
Support and Resistance Levels are the Levels that serve as targets when buying or selling the pair. You can place Take Profit near these levels.
Red lines are the channels or trendlines that display the current trend and show in which direction it is better to trade now.
Up/down arrows show where you should sell or buy after reaching or breaking through particular levels.
The MACD indicator (14, 22, and 3) consists of a histogram and a signal line. When they cross, this is a signal to enter the market. It is recommended to use this indicator in combination with trend patterns (channels and trendlines).
Important announcements and economic reports that you can always find on the economic calendar can seriously influence the trajectory of a currency pair. Therefore, at the time of their release, we recommend trading as carefully as possible or exit the market in order to avoid sharp price fluctuations.
Beginners on Forex should remember that not every single trade has to be profitable. The development of a clear strategy and money management are the key to success in trading over a long period of time.