Analysis of Friday deals:
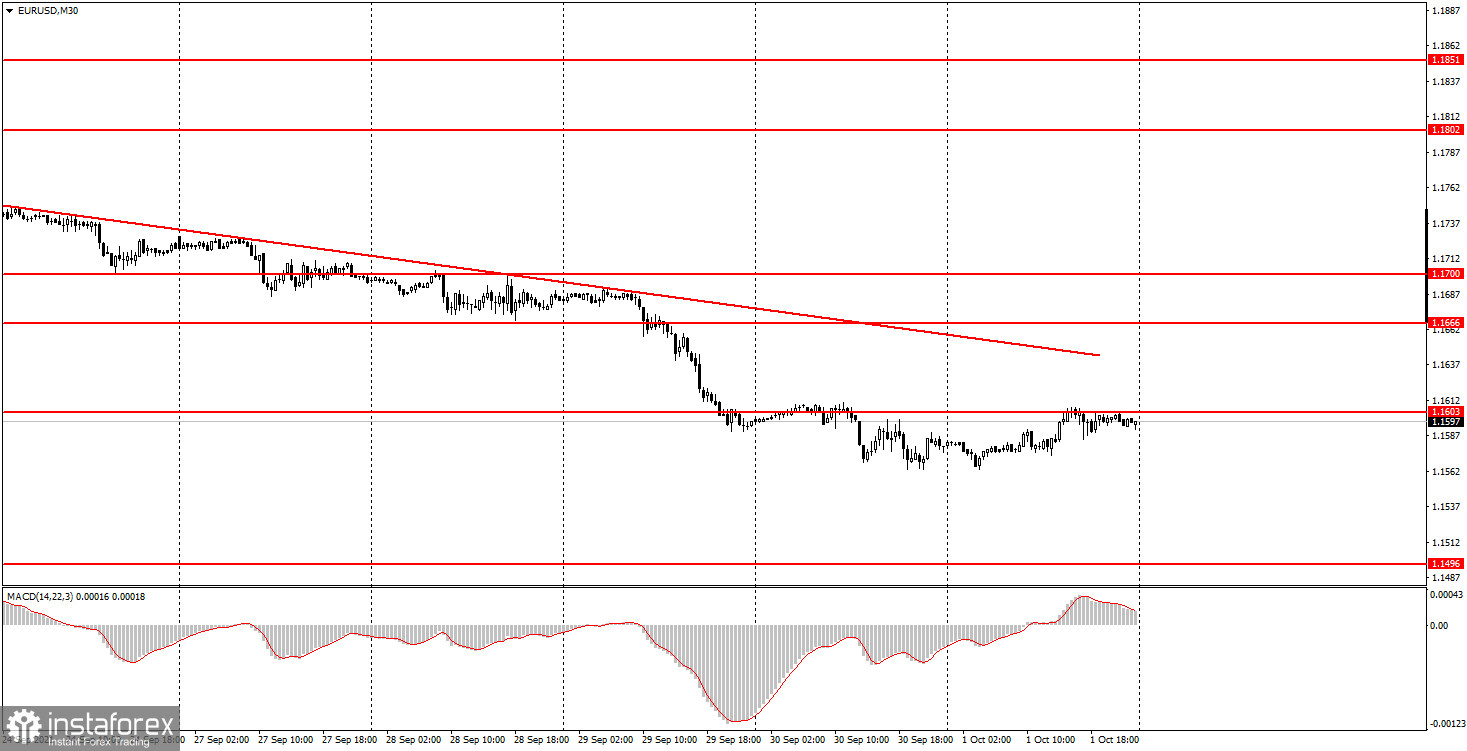
30M chart of the EUR/USD pair
The EUR/USD pair continued to be in a downward trend on Friday, which is eloquently evidenced by the downtrend line. Nevertheless, if we look at the direction and nature of the movement, we can draw the following conclusions. First, the volatility was too low again, only about 40 points. And we have already said many times that with such volatility, trading is, in principle, very difficult. Secondly, the pair began to correct, but this correction is so weak so far that it is very difficult to call it a "correction". And this is all despite the fact that there were quite significant publications of macroeconomic statistics in the European Union and in the United States on Friday. For example, in the European Union there was a report on inflation (second checkmark in the chart below), and in the US - an ISM report on business activity (fourth checkmark). But, as we can see, no serious movements began after all the reports of the day. The only exception can be the ISM report, after which the quotes fell by 17 points in 5 minutes, which was already an achievement for the pair on October 1. With such a movement, even the MACD indicator was unable to form a single signal during the day. In the middle of the day, there was an attempt to reverse down near the zero level, but the reversal did not occur. With such volatility, it is better for novice traders to again ignore the signals of the MACD indicator.
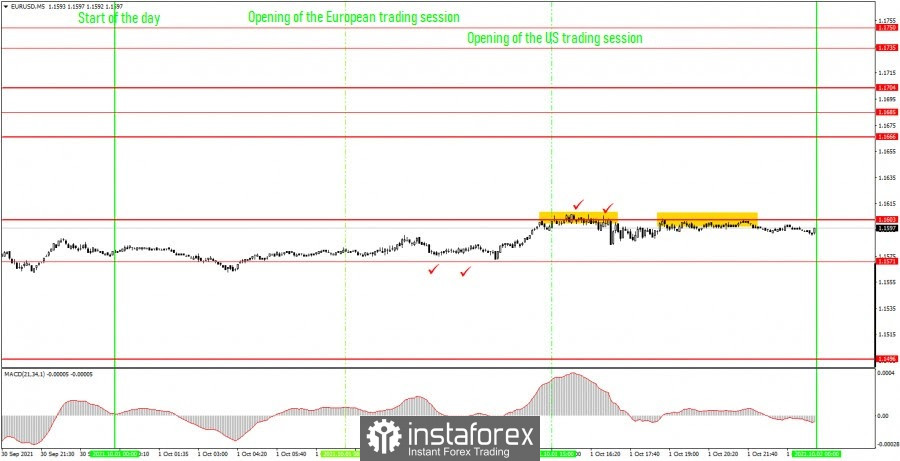
5M chart of the EUR/USD pair
The technical picture on the 5-minute timeframe was frankly boring last Friday. We have already talked about macroeconomic reports above, here we will analyze trading signals. In principle, there were not many of them, only two. And both did not bring any profit to the newcomers. On the other hand, with such a movement, the absence of losses is almost a profit. The main movement of the day happened a couple of hours before the opening of the US trading session, but the price did not form any signal in front of it. There were two bounces from the level of 1.1603, both are not accurate and these were two sell signals. Theoretically, several profit points could be taken after the first signal, but in practice the pair could not go down more than 20 points. That is, a short position should have been closed either manually near the same level of 1.1603, or by Stop Loss at breakeven, since the price also could not go above the level of 1.1603.
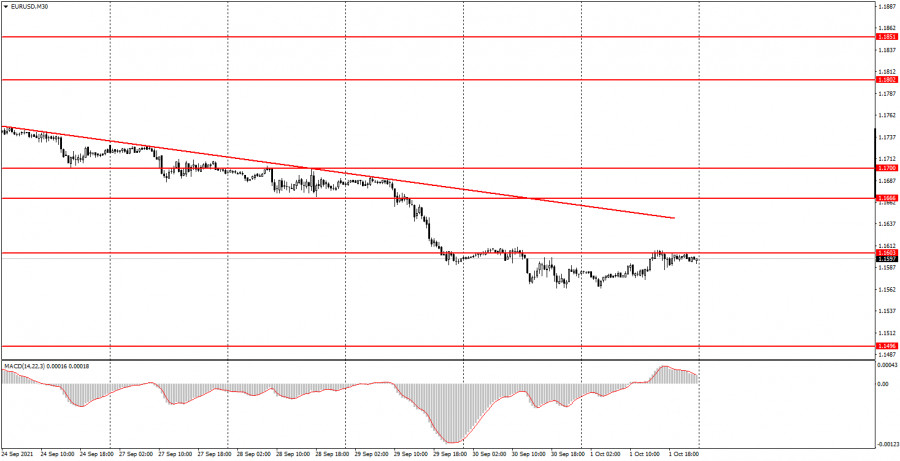
How to trade on Monday:
The EUR/USD pair has formed a new downward trend on the 30-minute timeframe and continues to adhere to it. Unlike the pound, the euro quickly returned to its usual pattern of movement and its usual volatility. Therefore, in the near future, we again advise against using the MACD indicator as a source of trading signals. And next week there will be little macroeconomic statistics, so it is highly likely that volatility will remain low. The key levels on the 5-minute timeframe for October 4 are 1.1496, 1.1571, 1.1603, 1.1666. Take Profit, as before, is set at a distance of 30-40 points. Stop Loss - to breakeven when the price passes in the right direction by 15 points. At the 5M TF, the target can be the nearest level if it is not too close or too far away. If it is, then you should act according to the situation or work according to Take Profit. On Monday, neither the US nor the European Union will publish a single macroeconomic report and no fundamental events are planned. Therefore, we do not expect strong movements during the day.
On the chart:
Support and Resistance Levels are the Levels that serve as targets when buying or selling the pair. You can place Take Profit near these levels.
Red lines are the channels or trend lines that display the current trend and show in which direction it is better to trade now.
The MACD indicator (14,22,3) consists of a histogram and a signal line. When they cross, this is a signal to enter the market. It is recommended to use this indicator in combination with trend lines (channels and trend lines).
Important speeches and reports (always contained in the news calendar) can greatly influence the movement of a currency pair. Therefore, during their exit, it is recommended to trade as carefully as possible or exit the market in order to avoid a sharp price reversal against the previous movement.
Beginners on Forex should remember that not every single trade has to be profitable. The development of a clear strategy and money management are the key to success in trading over a long period of time.