empty
 
 
27.10.2021 01:18 PM
USD/JPY technical analysis for October 27, 2021

In today's article on the dollar/yen pair, we will look at the technical picture at several time intervals, and start with the weekly one.

Weekly

This image is no longer relevant

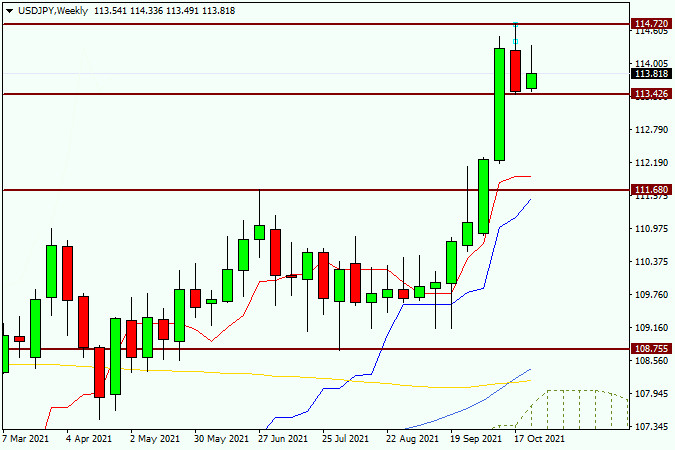
After a fairly long trade in the range of 111.68-108.75, the bulls on the instrument ran out of patience, and they made considerable efforts to exit this corridor upwards. At the same time, the last weekly candle was formed in the form of a reversal model of the "Harami" candle analysis. As you can see, at this week's auction, the bulls tried to continue the rate rise. However, after reaching the level of 114.33, the bullish candle began to deflate, and it already has a fairly long upper shadow. What's next? The question is interesting. Personally, given the weekly harami candle and the strength of resistance on the approach to 115.00, I expect a pullback to the broken resistance in the area of 112.00-111.70, where the pair can find support and resume growth. However, according to the weekly timeframe, it is very difficult (if at all possible) to find the exact points to enter the market.

Daily

This image is no longer relevant

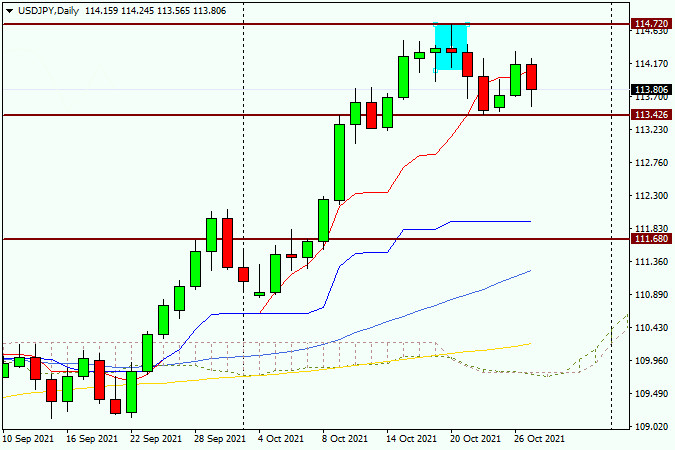
But on the daily chart of the pair on October 20, a reversal model of candle analysis "Rickshaw", or "Long-legged Doji" appeared. They are sufficiently similar, so the point is in their reversal character. The pair began to implement a downward scenario, while not forgetting to give kickbacks, after which you can plan sales. All this is very generous and technical. The pair is circling the Tenkan line of the Ichimoku indicator, and it is under selling pressure. I think the main question is whether the support near the very strong technical level of 113.40 will be able to contain the pressure of sellers and turn the course in the north direction. In case of a breakdown of this support level, we sell on a rollback to it. If a candle or a combination of reversal candlesticks of candle analysis appears above this mark, a signal will appear to open long positions. Personally, in my opinion, the growth of the pair can probably be considered completed, and after short-term pullbacks, open short positions. I recommend looking for the nearest sales on the approach to a very serious and important mark of 114.00.

Ivan Aleksandrov,
انسٹافاریکس کا تجزیاتی ماہر
© 2007-2024
انسٹافاریکس کے ساتھ کرپٹو کرنسی کی معاملاتی تبدیلیوں سے کمائیں۔
میٹا ٹریڈر 4 ڈاؤن لوڈ کریں اور اپنی پہلی ٹریڈ کھولیں۔
  • Grand Choice
    Contest by
    InstaForex
    InstaForex always strives to help you
    fulfill your biggest dreams.
    مقابلہ میں شامل ہوں
  • چانسی ڈیپازٹ
    اپنے اکاؤنٹ میں 3000 ڈالر جمع کروائیں اور حاصل کریں$1000 مزید!
    ہم اپریل قرعہ اندازی کرتے ہیں $1000چانسی ڈیپازٹ نامی مقابلہ کے تحت
    اپنے اکاؤنٹ میں 3000 ڈالر جمع کروانے پر موقع حاصل کریں - اس شرط پر پورا اُترتے ہوئے اس مقابلہ میں شرکت کریں
    مقابلہ میں شامل ہوں
  • ٹریڈ وائز، ون ڈیوائس
    کم از کم 500 ڈالر کے ساتھ اپنے اکاؤنٹ کو ٹاپ اپ کریں، مقابلے کے لیے سائن اپ کریں، اور موبائل ڈیوائسز جیتنے کا موقع حاصل کریں۔
    مقابلہ میں شامل ہوں
  • 100 فیصد بونس
    اپنے ڈپازٹ پر 100 فیصد بونس حاصل کرنے کا آپ کا منفرد موقع
    بونس حاصل کریں
  • 55 فیصد بونس
    اپنے ہر ڈپازٹ پر 55 فیصد بونس کے لیے درخواست دیں
    بونس حاصل کریں
  • 30 فیصد بونس
    ہر بار جب آپ اپنا اکاؤنٹ ٹاپ اپ کریں تو 30 فیصد بونس حاصل کریں
    بونس حاصل کریں

تجویز کردہ مضامین

ابھی فوری بات نہیں کرسکتے ؟
اپنا سوال پوچھیں بذریعہ چیٹ.
Widget callback