EUR/USD 5M
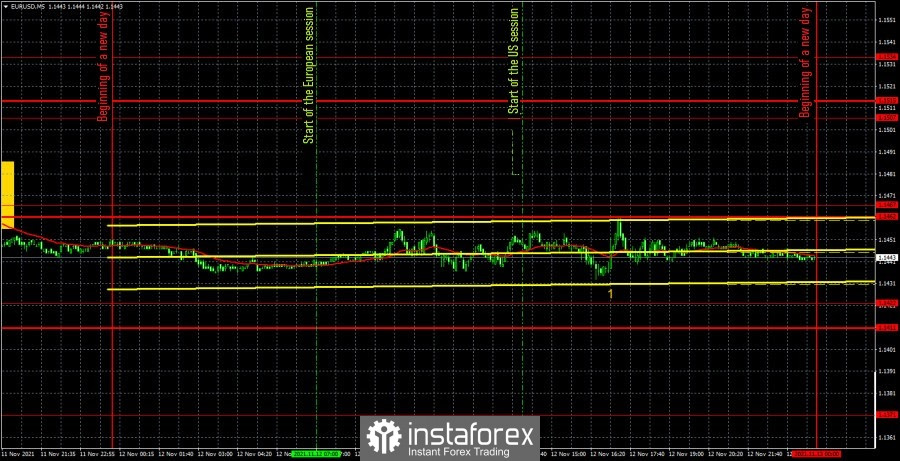
The EUR/USD pair was moving in absolute flat last Friday. Volatility was an "unrealistic" 29 points, so it was extremely difficult not to count on profit, but even on the formation of trading signals. However, not a single trading signal was formed on Friday. Which is probably even for the best, since with a high degree of probability they would turn out to be false. The only report of the day that can be noted is this consumer sentiment index from the University of Michigan, which turned out to be 5 points below the forecast. This report provoked the strongest movement of the day: the pair went 20 points up in 20 minutes. However, to be honest, there was no sense from such a movement. As already mentioned, the price has never approached the extreme levels or the lines of the Ichimoku indicator, and no signals are formed near the support and resistance levels. Thus, not a single transaction was opened on Friday.
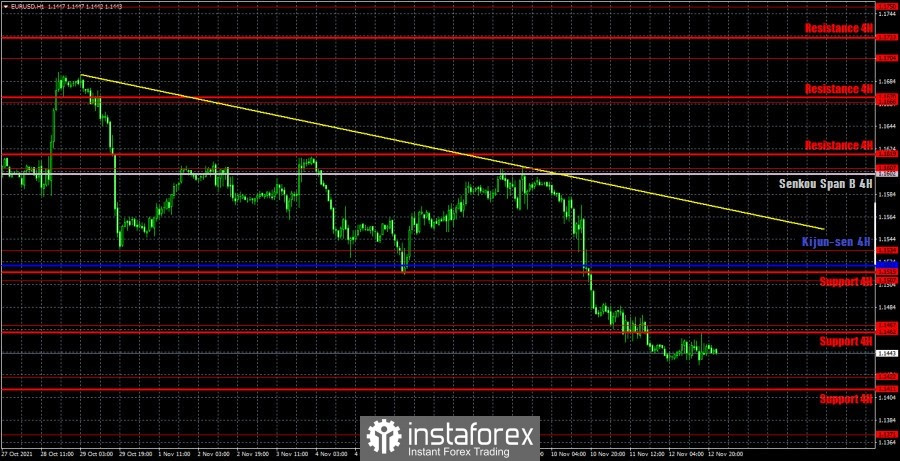
EUR/USD 1H

The downward trend persists on the hourly timeframe, and Friday's movement does not even need any comments - everything is clear anyway. Thus, in the context of one or two weeks, based on the situation on the hourly TF, the downward movement may continue. However, we remind you that the pair continues to trade in the "one day is good, four days is flat" mode. Therefore, you should be careful when opening any positions. On Monday, we highlight the following levels for trading - 1.1371, 1.1422, 1.1467, 1.1507, 1.1534, as well as the Senkou Span B (1.1602) and Kijun-sen (1.1521) lines. The Ichimoku indicator lines can change their position during the day, which should be taken into account when looking for trading signals. Signals can be rebounds or breakthroughs of these levels and lines. Do not forget about placing a Stop Loss order at breakeven if the price moves 15 points in the right direction. This will protect you against possible losses if the signal turns out to be false. No important macroeconomic event in the European Union on November 15, but there will be a speech by European Central Bank President Christine Lagarde. Nothing scheduled for the United States on Monday. In theory, Lagarde's speech can provoke a reaction from the markets, but only if she provides information unknown to the markets or unexpected information, which is unlikely.
We recommend you to familiarize yourself:
Overview of the EUR/USD pair. November 15. Does Jerome Powell have a real chance of keeping his post?
Overview of the GBP/USD pair. November 15. London threatened to use Article 16, but so far has changed his mind
Forecast and trading signals for GBP/USD for November 15. Detailed analysis of the movement of the pair and trade deals.
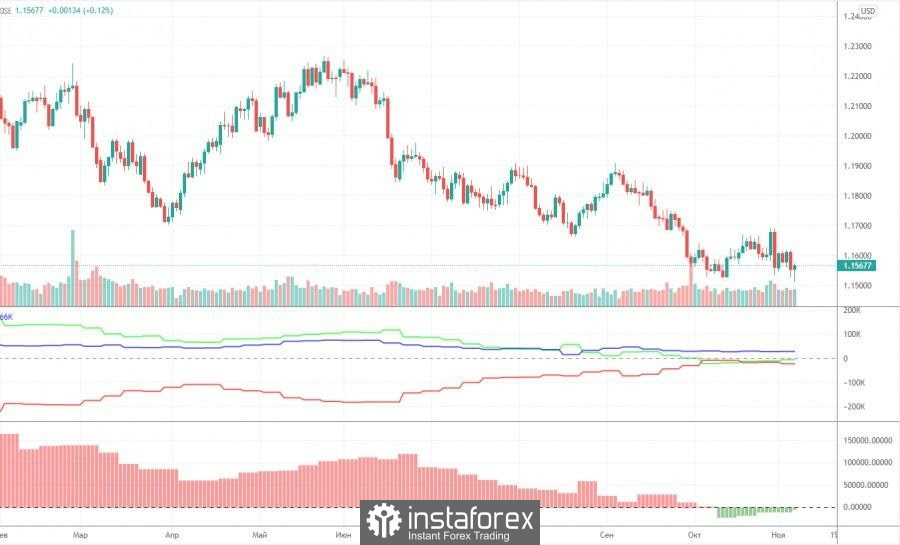
Analysis of the COT report

The mood of non-commercial traders changed, but not much, during the last reporting week (October 26-November 1). A group of "non-commercial" traders closed 4,000 buy contracts (longs) and 10.5 thousand sell contracts (shorts) during the reporting week. Consequently, the net position of professional players has grown by 6.5 thousand, which is not so much. However, the changes in the mood of non-commercial traders are best seen by the first indicator in the chart above. The red and green lines have been moving towards each other for a long time, and in the last couple of months they have been almost at the same level. This suggests that the previous trend is ending, and the mood of the major players at this time is as neutral as possible. This is confirmed by the data on the total number of contracts. The non-commercial group has 195,000 buy contracts (longs) and 199,000 sell contracts (shorts). The commercial group has 418,000 buy contracts and 442,000 sell contracts. That is, as we can see, the numbers are almost the same. Therefore, there are theoretical chances for the continuation of the downward movement in the pair. The trend began to end (an upward trend) when the red and green lines (net positions of the commercial and non-commercial groups) began to narrow. That is, for quite a long time. And now, logically, the downward trend continues. However, this "trend" is still not too similar to the trend. Rather, a banal three-wave correction.
Explanations for the chart:
Support and Resistance Levels are the levels that serve as targets when buying or selling the pair. You can place Take Profit near these levels.
Kijun-sen and Senkou Span B lines are lines of the Ichimoku indicator transferred to the hourly timeframe from the 4-hour one.
Support and resistance areas are areas from which the price has repeatedly rebounded off.
Yellow lines are trend lines, trend channels and any other technical patterns.
Indicator 1 on the COT charts is the size of the net position of each category of traders.
Indicator 2 on the COT charts is the size of the net position for the non-commercial group.


