empty
 
 
17.11.2021 07:40 AM
ETH down by 9%: How big could ether's fall be?

Ether has been bullish since September. The asset has not been able to enter a correction until today. To set a new record high, the price should stabilize. ETH has started to retrace upward after negative fundamental background and a drop in bitcoin. At the same time, on-chain metrics have long signaled the possibility of an imminent decline in price.

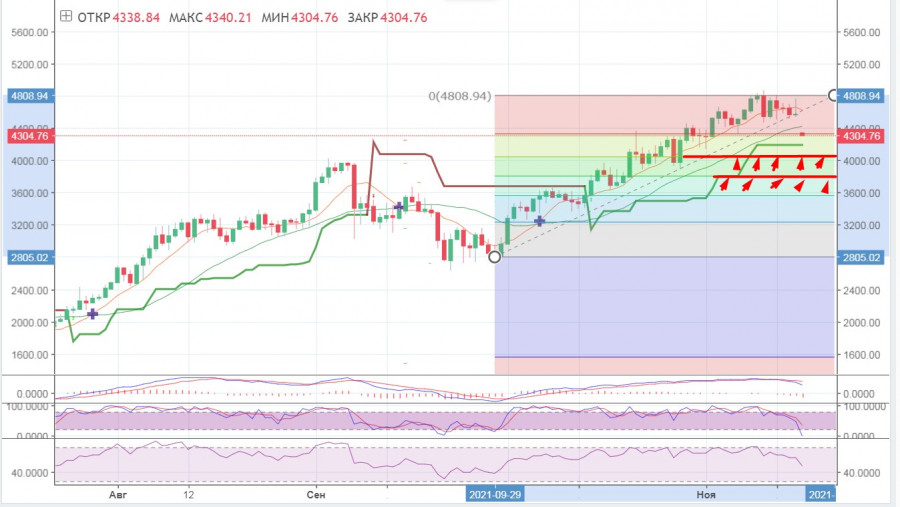
As a result, amid tighter cryptocurrency market regulation and China's crackdown on the industry, ETH lost 8% on Monday and 11% in the previous week. Total losses from transactions with ether amounted to $222 million, most of which were long positions. On the weekly chart, a bearish breakout of the medium-term uptrend took place, with the quote traded at $4.3K. The price is in the key support zone, in line with the first Fibonacci level. A breakout of this mark is likely to indicate a deeper correction and a retest of important levels of $4K and $3,7K that are in line with the second and third Fibonacci levels respectively. Overall, ether is likely to remain bearish, which is confirmed by technical indicators and the moving averages. The MACD has formed a bear crossover and continues to go down to zero, indicating a bearish market. The Stochastic indicator is above the bullish zone and is heading towards 25, signaling an increase in long positions and bearish market sentiment. The Relative Strength Index is moving down and is likely to break through 40 and leave the bullish zone.

This image is no longer relevant

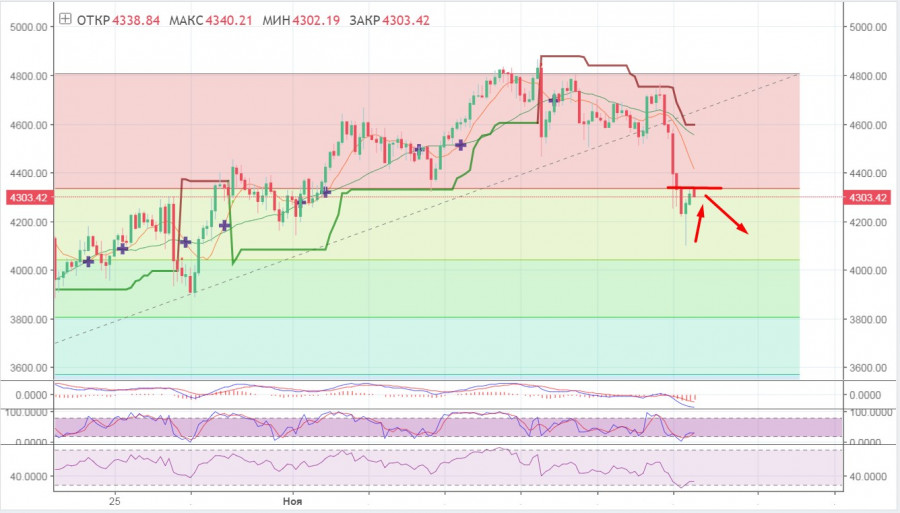
On the H4 chart, there are signs of a bearish trend and a possible retest of the level of $4K that is in line with the second Fibonacci level. After a breakout at $4,3K, bulls started to push the price from the support level of $4K to the first Fibonacci level. However, the quote failed to go above $4,3K and started to fall, indicating the weakness of bulls and the strength of bears that were pushing the price further down. ETH is expected to remain in a bearish trend. In case of a breakout at $4,2K, the price is likely to retest the $4K mark and retrace. This support level has been tested several times, which increases the possibility of a bearish breakout. Technical indicators are also signaling a bearish trend. The MACD maintains its downward dynamics, while the Stochastic Oscillator is forming a bearish crossover after attempting to reverse upward. This is an important bearish signal showing the weakness of bulls and the lack of strong short-term upward momentum. The RSI is moving sideways. Overall, the H4 chart confirms a bearish trend on ETH/USD. In case of a retest of the level of $4K, the price is likely to fall to $3,7K. If so, the quote is likely to recover and reach $5K before heading towards $6,8K.

This image is no longer relevant

Artem Petrenko,
انسٹافاریکس کا تجزیاتی ماہر
© 2007-2024
انسٹافاریکس کے ساتھ کرپٹو کرنسی کی معاملاتی تبدیلیوں سے کمائیں۔
میٹا ٹریڈر 4 ڈاؤن لوڈ کریں اور اپنی پہلی ٹریڈ کھولیں۔
  • Grand Choice
    Contest by
    InstaForex
    InstaForex always strives to help you
    fulfill your biggest dreams.
    مقابلہ میں شامل ہوں
  • چانسی ڈیپازٹ
    اپنے اکاؤنٹ میں 3000 ڈالر جمع کروائیں اور حاصل کریں$9000 مزید!
    ہم مئي قرعہ اندازی کرتے ہیں $9000چانسی ڈیپازٹ نامی مقابلہ کے تحت
    اپنے اکاؤنٹ میں 3000 ڈالر جمع کروانے پر موقع حاصل کریں - اس شرط پر پورا اُترتے ہوئے اس مقابلہ میں شرکت کریں
    مقابلہ میں شامل ہوں
  • ٹریڈ وائز، ون ڈیوائس
    کم از کم 500 ڈالر کے ساتھ اپنے اکاؤنٹ کو ٹاپ اپ کریں، مقابلے کے لیے سائن اپ کریں، اور موبائل ڈیوائسز جیتنے کا موقع حاصل کریں۔
    مقابلہ میں شامل ہوں
  • 100 فیصد بونس
    اپنے ڈپازٹ پر 100 فیصد بونس حاصل کرنے کا آپ کا منفرد موقع
    بونس حاصل کریں
  • 55 فیصد بونس
    اپنے ہر ڈپازٹ پر 55 فیصد بونس کے لیے درخواست دیں
    بونس حاصل کریں
  • 30 فیصد بونس
    ہر بار جب آپ اپنا اکاؤنٹ ٹاپ اپ کریں تو 30 فیصد بونس حاصل کریں
    بونس حاصل کریں

تجویز کردہ مضامین

ابھی فوری بات نہیں کرسکتے ؟
اپنا سوال پوچھیں بذریعہ چیٹ.
Widget callback