GBP/USD
Analysis:
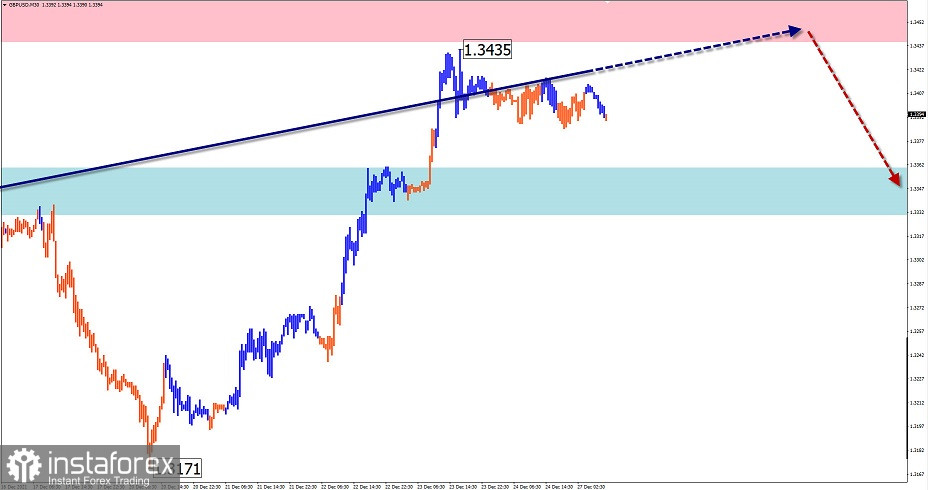
The direction of the British pound is set by the algorithm of the bearish wave from February 24. The price has been correcting upwards over the past month and a half, forming a shifting plane on the chart. The structure of this section of the price movement is close to completion.
Outlook:
Today, pressure on the resistance zone is expected in the morning. A short-term piercing of its upper boundary is possible. At the end of the day, there is a higher probability that the trend may change and a downward price movement begins.
Potential reversal zones
Resistance:
- 1.3440/1.3470
Support:
- 1.3360/1.3330
Recommendations:
The British currency has exhausted its purchasing potential. It is not recommended to buy the British pound as it may lead to losses. It is better not to enter the pair's market before clear signals for sale in the resistance area occur.
AUD/USD
Analysis:
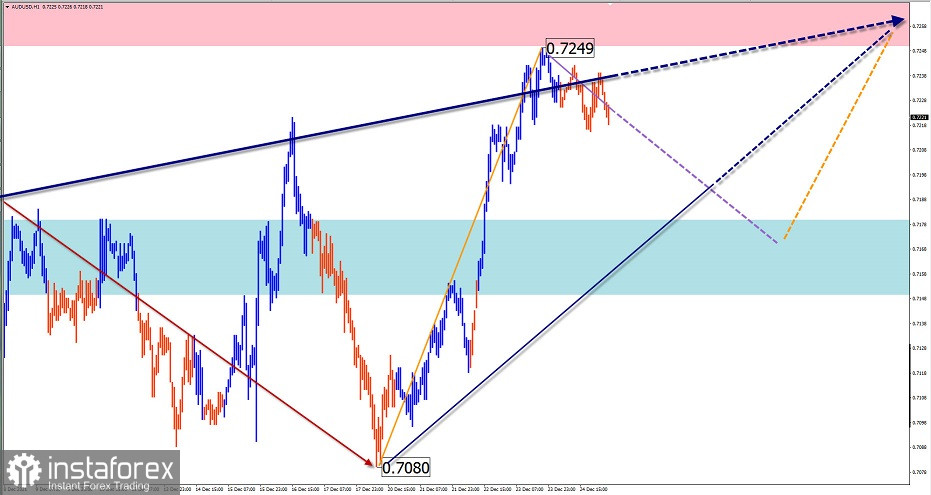
On the chart of the AUD/USD pair in the short term, the trend is set by the ascending wave from December 3. Its direction coincides with the global trend, which helps to predict its future movement. The quotes reached the boundaries of strong resistance of the senior TF.
Outlook:
The Australian dollar will mostly trade sideways flat, in the price corridor between the opposing zones. In the morning, a downward vector is possible. The start of a new rise and a new attempt to exert pressure on the resistance zone is more likely late in the day or tomorrow.
Potential reversal zones.
Resistance:
- 0.7250/0.7280
Support:
- 0.7180/0.7150
Recommendations:
Today, trading of the Australian dollar is more risky and can lead to deposit losses. It is recommended not to enter the pair's market until the forthcoming decline ends, searching for final buying signals.
USD/CHF
Analysis:
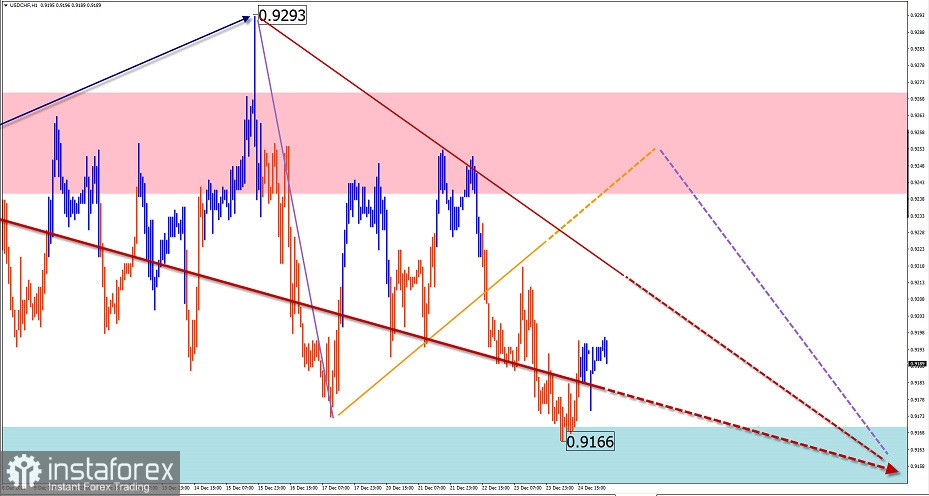
On the daily chart of the Swiss franc, an incomplete wave structure is a descending wave from June 18. On the chart, the structure resembles a horizontal shifting plane, lacking the final part. During the last month, in a sideways flat, the price is accumulating potential for a final downward spurt.
Outlook:
Today, a further general sideways move is expected. In the morning, an upward vector and price growth to the resistance area is likely. At the end of the day, there is a higher probability of the change of direction and a subsequent decline, including the support zone.
Potential reversal zones.
Resistance:
- 0.9240/0.9270
Support:
- 0.9170/0.9140
Recommendations:
Today, in the franc market trading is possible only with fractional lots within separate trading sessions. Selling looks more promising. They will be possible after the reversal signals in the resistance area.
USD/CAD
Analysis:
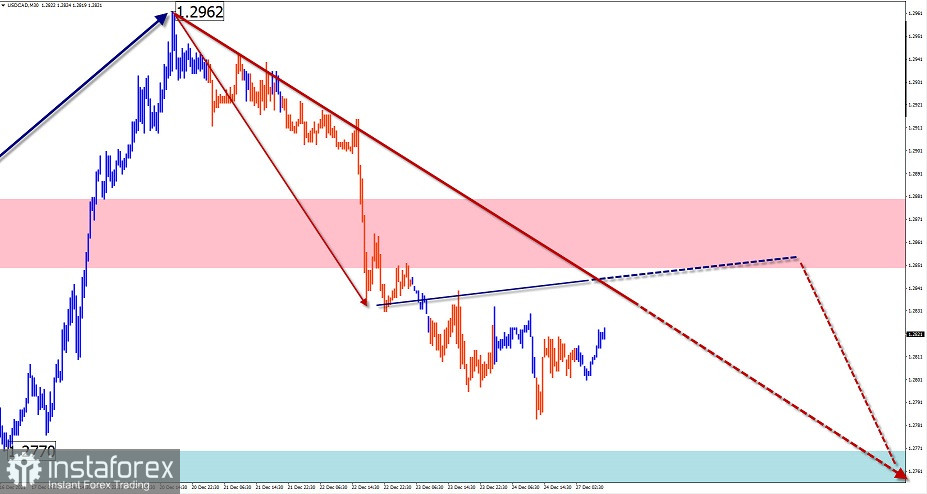
On the chart of the Canadian dollar, the price movements of recent weeks have influenced the overall wave picture. The price is further forming the upward correction, started in May, bringing it to a higher wave level. The quotes have been pulling back since the beginning of last week, forming an intermediate pullback.
Outlook:
During the next 24 hours, the price is expected to move in the corridor between the nearest zones, mainly with a downward vector. At the European session, a short-term rise to the resistance area is possible. The beginning of the downward phase may be followed by an increase in volatility.
Potential reversal zones.
Resistance:
- 1.2850/1.2880
Support:
- 1.2770/1.2740
Recommendations:
In the next 24 hours, there will be no conditions to buy the Canadian dollar. It is recommended not to enter the market until clear sell signals from your trading systems in the resistance area occur.
Explanation: In the simplified wave analysis (UVA), waves consist of 3 parts (A-B-C). The last incomplete wave is analyzed. The solid background of the arrows shows the formed structure and the dotted background shows the expected movements.
Note: The wave algorithm does not take into account the duration of the instrument's movements in time!