Long-term perspective.
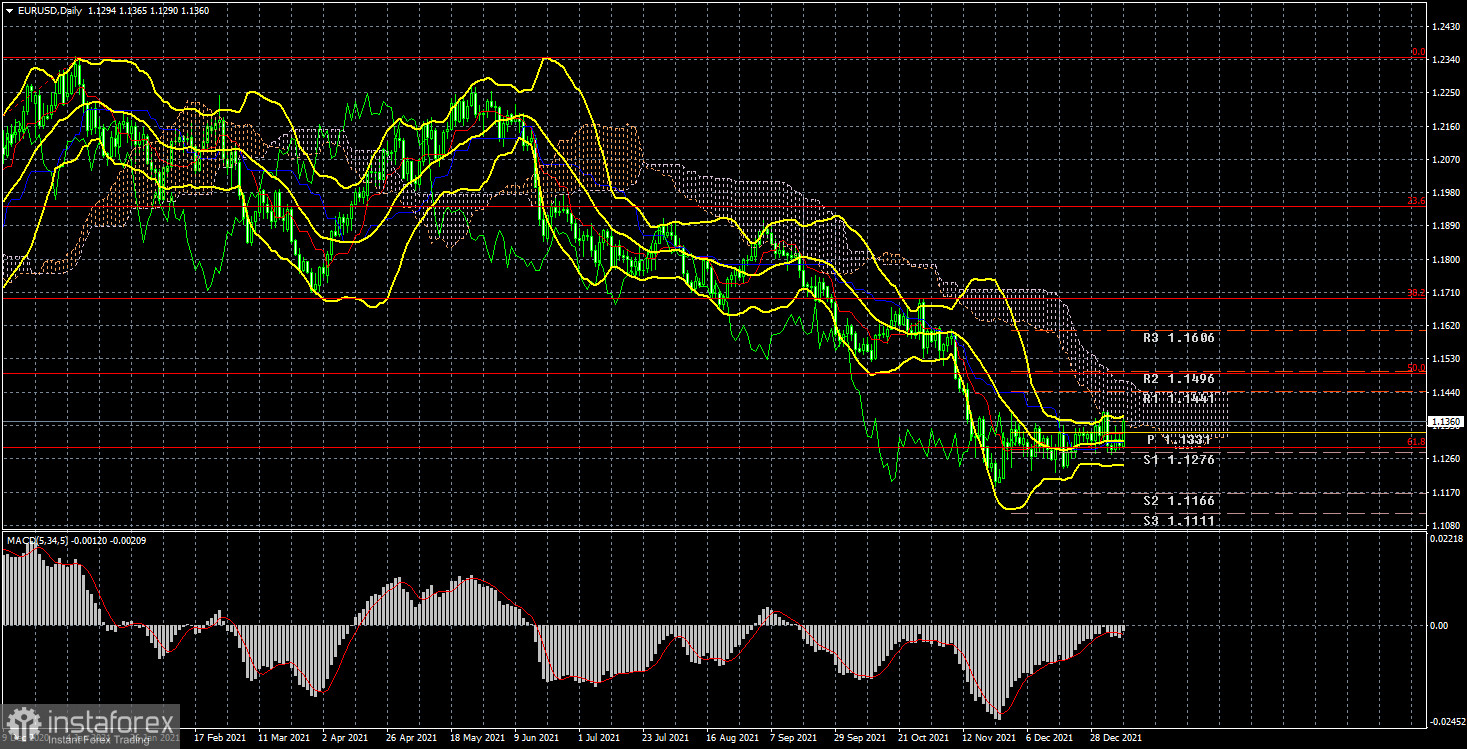
During the current week, the EUR/USD currency pair continued to remain inside the side channel, which it has been for more than a month. And the current week, which became the first in the new year, was not an exception or a week of "big changes". In other words, traders again failed to withdraw the pair from the side channel, the boundaries of which run approximately along with the levels of 1.1230 and 1.1350. The pair ended the week near the upper limit of this channel, as on Friday the American statistics again disappointed traders. However, this will be discussed a little later. So far, I would like to say that the minimum upward slope is still present. We have already said that this minimum bias can be expressed by 120 points of growth of the European currency in a month and a half. As we can see, this upward trend has a purely formal appearance and essence. Naturally, it is still very difficult to trade a pair in a flat environment. Complicating the situation is the fact that the lateral channel has no clear boundaries. Twice this week, the pair tried to get out of it through the upper boundary and twice failed. Thus, the most important conclusion is that the pair is in a very limited range and there is even no difference whether there is an upward slope at this time or the movement is purely lateral. The flat is even better visible on the 24-hour TF than on the 4-hour TF. Bollinger bands have narrowed to a minimum. The nearest target of the current movement may be the Senkou Span B line, which runs at the level of 1.1440. However, when the pair will be able to get to this level, it is very difficult to say. In principle, now it remains only to wait for the moment when the price completes the flat, or to trade on the lowest timeframes in the hope of a trend movement within individual days.
Analysis of fundamental events.
What can I say about the "foundation" in the reporting week? There were few macroeconomic events, but there was something. Of course, in the first place in terms of importance and significance is the Nonfarm Payrolls report, which failed for the second time in a row. This time, the number of new jobs outside the agricultural sector amounted to 199 thousand, with a forecast of 426 thousand. Approximately the same pattern was observed a month earlier. Given the fact that omicron is currently raging all over the world, it would be foolish to think that it will have no impact on the economy and the labor market. It seems that we are now seeing the effects of a new strain. At the same time, it should be recognized that every month cannot be successful. Perhaps weak Nonfarms are only partially related to omicron. Anyway, this report still did not affect the technical picture of the pair in any way. It should also be noted that inflation in the Eurozone continues to grow and by the end of December was already 5.0% y/y, although the markets expected it to slow down to 4.8%. But, as we can see, Christine Lagarde's forecasts that inflation will begin to slow down have not yet come true in the same way as Jerome Powell's forecasts.
Trading plan for the week of January 10-14:
1) On a 24-hour timeframe, the overall trend remains downward. And the movement itself in the last 5-6 weeks remains a pure flat. Thus, there are still chances for a resumption of the downward movement, but so far the markets do not find grounds to withdraw the pair from the side channel. Most likely, the markets will not even need any important event to complete the flat. There have been such events over the past month, but they have not helped in any way. Most likely, the flat will end on its own, thanks to market mechanisms.
2) As for purchases of the euro/dollar pair, in the current conditions, they should be considered no earlier than fixing the price above the Ichimoku cloud, because the price in 2021 overcame the Kijun-sen several times, but then could not continue moving up. There are no prerequisites for a new upward trend to begin in the near future yet. First of all, technical.
Explanations to the illustrations:
Price levels of support and resistance (resistance /support), Fibonacci levels - target levels when opening purchases or sales. Take Profit levels can be placed near them.
Ichimoku indicators (standard settings), Bollinger Bands (standard settings), MACD (5, 34, 5).