Analysis of previous deals:
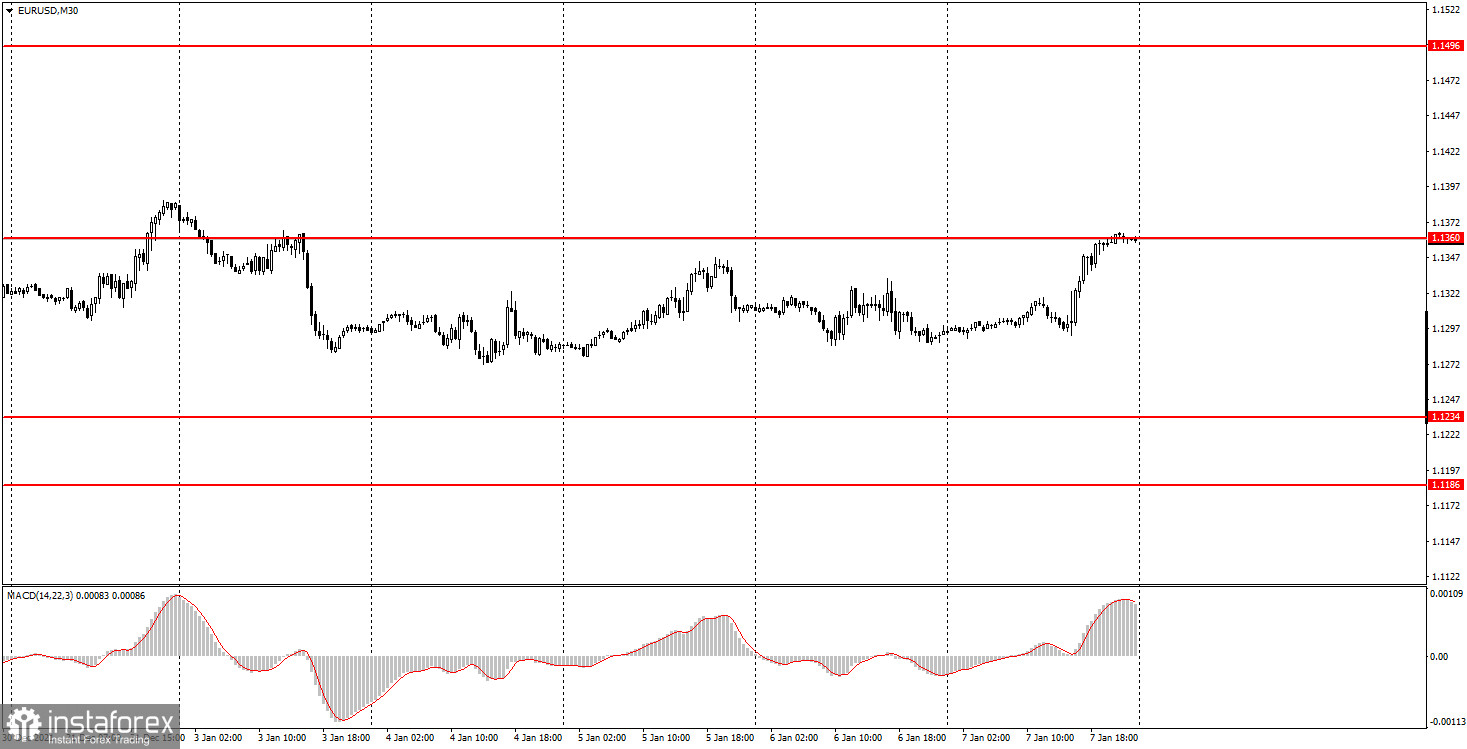
30M chart of the EUR/USD pair
The EUR/USD pair was trading quite calmly on Friday. Until the time when the Nonfarm report was published in the US. As a reminder to novice traders, this report reflects the number of new jobs created outside the agricultural sector and is one of the most important macroeconomic events. It is easy to guess that if the actual value is higher than the forecast, this will support the dollar, and vice versa. This report fell through on Friday. It failed for the second consecutive time, as the actual value was also lower than forecasted at the end of November. Therefore, the US dollar fell by about 70 points in the second half of Friday. Moreover, at the same time, less important reports on unemployment (decrease from 4.2% to 3.9%) and on wages were ignored. And even earlier, at the European trading session (the first tick in the chart below), the report on inflation in the European Union was ignored, which continued its growth and amounted to 5.0% y/y in December. Thus, the reaction was only to NonFarm Payrolls, but even this report could not lead to the pair leaving the 1.1234-1.1360 horizontal channel.
5M chart of the EUR/USD pair
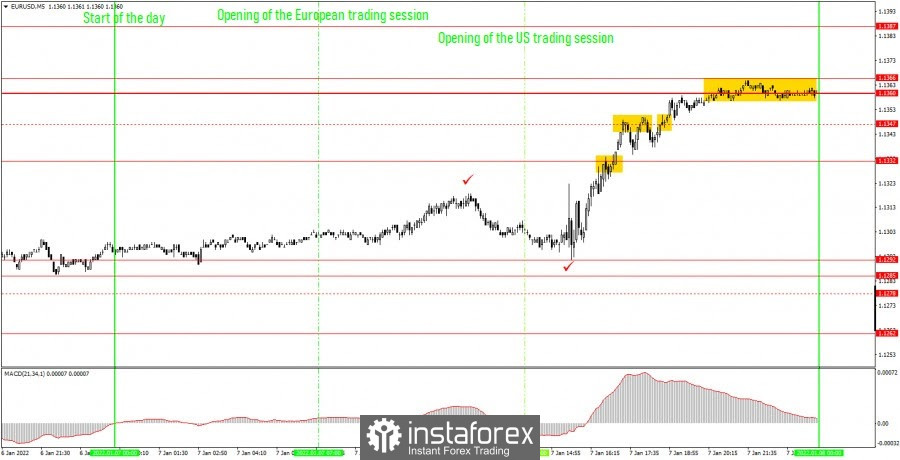
On the 5-minute timeframe, the move was not the best on Friday, from a technical point of view. The problem is that the pair continues to remain inside the horizontal channel, and if you build levels based on local lows and highs, then there are a lot of them and they are located too close to each other. Therefore, they constantly have to be corrected and refined. This state of affairs led to the fact that on Friday the nearest levels were located quite far from the price and for the first time the pair touched only one of them at the US session after US reports were published. Thus, the first buy signal was generated near the level of 1.1332, and there were exactly 15 points to the next level. Therefore, a long position in this case should not have been opened. As it turned out later, it was absolutely correct, because the upward momentum had already expired by that time, and the market was preparing to close. As a result, two rebounds immediately followed from the level of 1.1347, which also should not have been worked out, since the nearest level from below was also only 15 points away. As a result, no positions should have been opened on Friday. We draw your attention to the highly volatile and multidirectional movements of the pair at the time when the Nonfarm was published (second check mark).
How to trade on Monday:
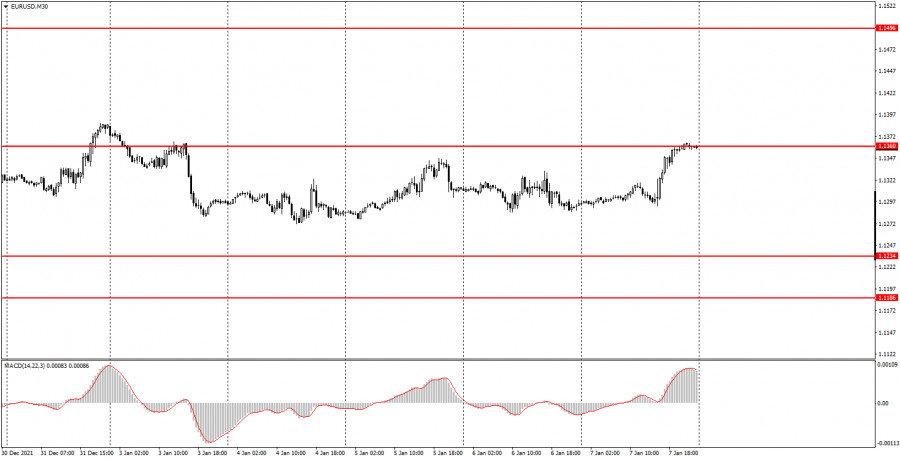
The sideways trend continues on the 30-minute timeframe. The price continues to remain between the levels of 1.1234 and 1.1360, so there is still no trend now, and it is extremely difficult to trade on this TF. In case of a rebound from the level of 1.1360 on Monday, it will be possible to consider the possibility of selling the pair, but this level can be overcome. There are much more levels on the 5-minute timeframe. Tomorrow we recommend trading on the following: 1.1332, 1.1360-1.1366, 1.1387, 1.1422. Recall that for any trade you should set Take Profit 30-40 points and Stop Loss at breakeven after passing 15 points in the right direction. The deal can also be closed manually near important levels or after the formation of an opposite signal. Macroeconomic statistics on Monday will not be in the United States or the European Union. Formally, the EU will publish the unemployment rate, but we do not believe that there will be even a minimal reaction to it.
On the chart:
Support and Resistance Levels are the Levels that serve as targets when buying or selling the pair. You can place Take Profit near these levels.
Red lines are the channels or trend lines that display the current trend and show in which direction it is better to trade now.
The MACD indicator (14,22,3) consists of a histogram and a signal line. When they cross, this is a signal to enter the market. It is recommended to use this indicator in combination with trend lines (channels and trend lines).
Important speeches and reports (always contained in the news calendar) can greatly influence the movement of a currency pair. Therefore, during their exit, it is recommended to trade as carefully as possible or exit the market in order to avoid a sharp price reversal against the previous movement.
Beginners on Forex should remember that not every single trade has to be profitable. The development of a clear strategy and money management are the key to success in trading over a long period of time.