empty
 
 
07.12.2022 10:42 PM
Technical analysis of EUR/USD for December 07, 2022

This image is no longer relevant

Overview:

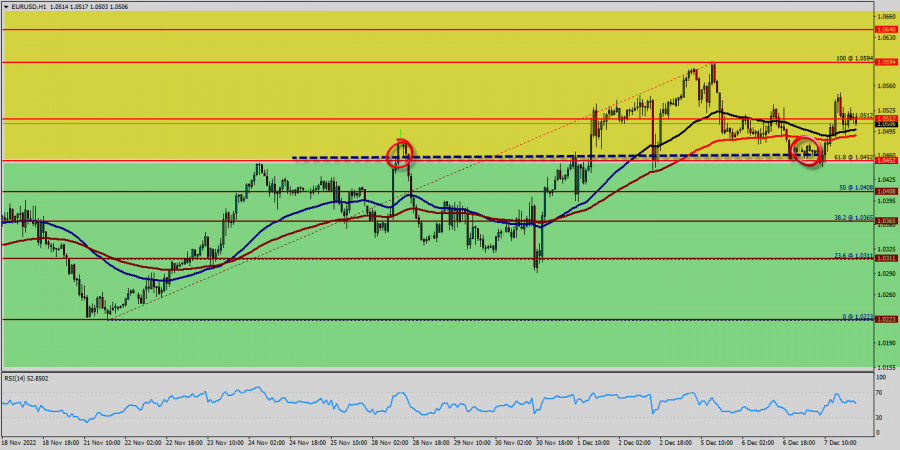
The EUR/USD pair has faced strong resistances at the levels of 1.0512 because support had become resistance on Nov. 29, 2022. So, the strong resistance has been already formed at the level of 1.0512 and the pair is likely to try to approach it in order to test it again. However, if the pair fails to pass through the level of 1.0512, the market will indicate a bearish opportunity below the new strong resistance level of 1.0512 (the level of 1.0512 coincides with a ratio of 78% Fibonacci).

Moreover, the RSI starts signaling a downward trend, as the trend is still showing strength above the moving average (100) and (50). The EUR/USD pair continues to move downwards from the level of 1.0480. Yesterday, the pair dropped from the level of 1.0480 to the bottom around 1.0300. But the pair has rebounded from the bottom of 1.0300 to close at 1.0333. The EUR/USD pair's outlook and further decline is expected with 1.0512 minor resistance intact. Current down trend should move from the last resistance levels of 1.0512 and 1.0482.

Firm break there could prompt downside acceleration to last bearish wave of 1.0512 and 1.0482 (these resistance levels have been rejected several times confirming the veracity of a downtrend). Today, the first support level is seen at 1.0300, the price is moving in a bearish channel now. Furthermore, the price has been set below the minor resistance at the level of 1.0284, which coincides with the 23.6% Fibonacci retracement level.

Thus, the market is indicating a bearish opportunity below 1.0512 so it will be good to sell at 1.0512 with the first target of 1.0300. It will also call for a downtrend in order to continue towards 1.0271. The daily strong support is seen at 1.0271. On other hand, the stop loss should always be taken into account, for that it will be reasonable to set your stop loss at the level of 1.0480.

According to previous events, the EUR/USD pair is still moving between the level of 1.0480 and the 1.0284 level (these levels coincided with the Fibonacci retracement levels 23.6% and last bullish wave). It should be noted that the 1.0512 price will act as a minor resistance today. Therefore, it will be too gainful to sell short below 1.0512 and look for further downside with 1.0300 and 1.0284 targets. It should also be reminded that stop loss must never exceed the maximum exposure amounts. Thus, stop loss should be placed at the 1.0480 level today.

EURUSD
Euro vs US Dollar
ٹائم فریم منتخب کریں
5
منٹ
15
منٹ
30
منٹ
1
گھنٹہ
4
گھنٹے
1
دن
1
ہفتہ
تجارت شروع کریں
تجارت شروع کریں
  • Grand Choice
    Contest by
    InstaForex
    InstaForex always strives to help you
    fulfill your biggest dreams.
    مقابلہ میں شامل ہوں
  • چانسی ڈیپازٹ
    اپنے اکاؤنٹ میں 3000 ڈالر جمع کروائیں اور حاصل کریں$8000 مزید!
    ہم مارچ قرعہ اندازی کرتے ہیں $8000چانسی ڈیپازٹ نامی مقابلہ کے تحت
    اپنے اکاؤنٹ میں 3000 ڈالر جمع کروانے پر موقع حاصل کریں - اس شرط پر پورا اُترتے ہوئے اس مقابلہ میں شرکت کریں
    مقابلہ میں شامل ہوں
  • ٹریڈ وائز، ون ڈیوائس
    کم از کم 500 ڈالر کے ساتھ اپنے اکاؤنٹ کو ٹاپ اپ کریں، مقابلے کے لیے سائن اپ کریں، اور موبائل ڈیوائسز جیتنے کا موقع حاصل کریں۔
    مقابلہ میں شامل ہوں
  • 100 فیصد بونس
    اپنے ڈپازٹ پر 100 فیصد بونس حاصل کرنے کا آپ کا منفرد موقع
    بونس حاصل کریں
  • 55 فیصد بونس
    اپنے ہر ڈپازٹ پر 55 فیصد بونس کے لیے درخواست دیں
    بونس حاصل کریں
  • 30 فیصد بونس
    ہر بار جب آپ اپنا اکاؤنٹ ٹاپ اپ کریں تو 30 فیصد بونس حاصل کریں
    بونس حاصل کریں

Recommended Stories

برطانوی پاؤنڈ/امریکی ڈالر کا تکنیکی تجزیہ برائے 31 مارچ 2023

تکنیکی مارکیٹ آؤٹ لک: برطانوی پاؤنڈ/امریکی ڈالر کی جوڑی نے 1.2422 کی سطح پر ایک اور اونچی سطح بنائی ہے کیونکہ اوپر کا رجحان جاری ہے۔ اس کے باوجود،

Sebastian Seliga 18:24 2023-03-31 UTC+2

یورو/امریکی ڈالر کا تکنیکی تجزیہ برائے 31 مارچ 2023

تکنیکی مارکیٹ آؤٹ لک: یورو/امریکی ڈالر بُلز بالآخر 1.0868 پر نظر آنے والی انٹرا ڈے تکنیکی مزاحمت کے اوپر ٹوٹ گئے اور 1.0930 پر واقع آخری سوئنگ ہائی کے قریب

Sebastian Seliga 18:23 2023-03-31 UTC+2

این ذیڈ ڈی / یو ایس ڈی کا تکنیکی تجزیہ برائے 31 مارچ 2023

این ذیڈ ڈی / یو ایس ڈی 0.6260 کے ارد گرد تجارت کر رہا ہے۔ قیمت نے حال ہی میں چوتھی بار کالی نیک لائن ریزسٹنس کو ٹیسٹ

Alexandros Yfantis 12:18 2023-03-31 UTC+2

یورو / یو ایس ڈی کا تکنیکی تجزیہ برائے 31 مارچ 2023

یورو / یو ایس ڈی 1.0886 کے ارد گرد تجارت کر رہا ہے۔ قیمت آج دباؤ میں ہے۔ قیمت نے اب تک کلیدی سپورٹ نیک لائن کا احترام

Alexandros Yfantis 12:11 2023-03-31 UTC+2

سونے کا تکنیکی تجزیہ برائے 31 مارچ 2023

سونے کی قیمت $1,979 کے ارد گرد تجارت کر رہی ہے۔ قیمت تکونی انداز کے اندر موجود ہے جس کا ہم نے اپنے پچھلے تجزیہ میں ذکر کیا ہے۔ قیمت

Alexandros Yfantis 12:03 2023-03-31 UTC+2

سونے کا تکنیکی تجزیہ برائے 30 مارچ 2023

سونے کی قیمت $1,968 کے ارد گرد تجارت کر رہی ہے۔ پچھلے دو ہفتوں کے دوران قیمت میں کوئی حقیقی پیش رفت نہیں ہوئی ہے۔ قیمت

Alexandros Yfantis 20:18 2023-03-30 UTC+2

مارچ 30-31 2023 کے لیے سونے (ایکس اے یو / یو ایس ڈی) کے لیے تجارتی اشارہ: $1,963 سے اوپر خریدیں یا $1,955 ٹوٹنے پر فروخت کریں (21 ایس ایم اے - 61.8% فیبوناچی)

ایکس اے یو / یو ایس ڈی فی الحال 1,963 پر واقع 21 ایس ایم اے سے اوپر تجارت کر رہا ہے جو بُلش عمل کے حق میں ہے۔

Dimitrios Zappas 19:42 2023-03-30 UTC+2

برطانوی پاؤنڈ/امریکی ڈالر کا تکنیکی تجزیہ برائے 30 مارچ 2023

تکنیکی مارکیٹ آؤٹ لک: برطانوی پاؤنڈ/امریکی ڈالر کی جوڑی نے 1.2360 کی سطح پر ایک اور اونچی سطح بنائی ہے کیونکہ اوپر کا رجحان جاری ہے۔ انٹرا ڈے تکنیکی

Sebastian Seliga 17:57 2023-03-30 UTC+2

یورو/امریکی ڈالر کا تکنیکی تجزیہ برائے 30 مارچ 2023

تکنیکی مارکیٹ آؤٹ لک: یورو/امریکی ڈالر کی جوڑی نے 1.0930 کی سطح پر آخری سوئنگ ہائی سے زیادہ اچھالنے اور توڑنے کی کوشش کی ہے، لیکن 1.0868 پر دیکھے جانے

Sebastian Seliga 17:57 2023-03-30 UTC+2

بی ٹی سی / یو ایس ڈی کا تکنیکی تجزیہ برائے 30 مارچ 2023

بٹ کوائن بُلش رجحان فی الحال بٰٹ کوائن - بی ٹی سی / یو ایس ڈی کے لیے بہت مضبوط ہے۔ جب تک قیمت 28 ہزار امریکی ڈالر پر سپورٹ

Mourad El Keddani 14:50 2023-03-30 UTC+2
ابھی فوری بات نہیں کرسکتے ؟
اپنا سوال پوچھیں بذریعہ چیٹ.