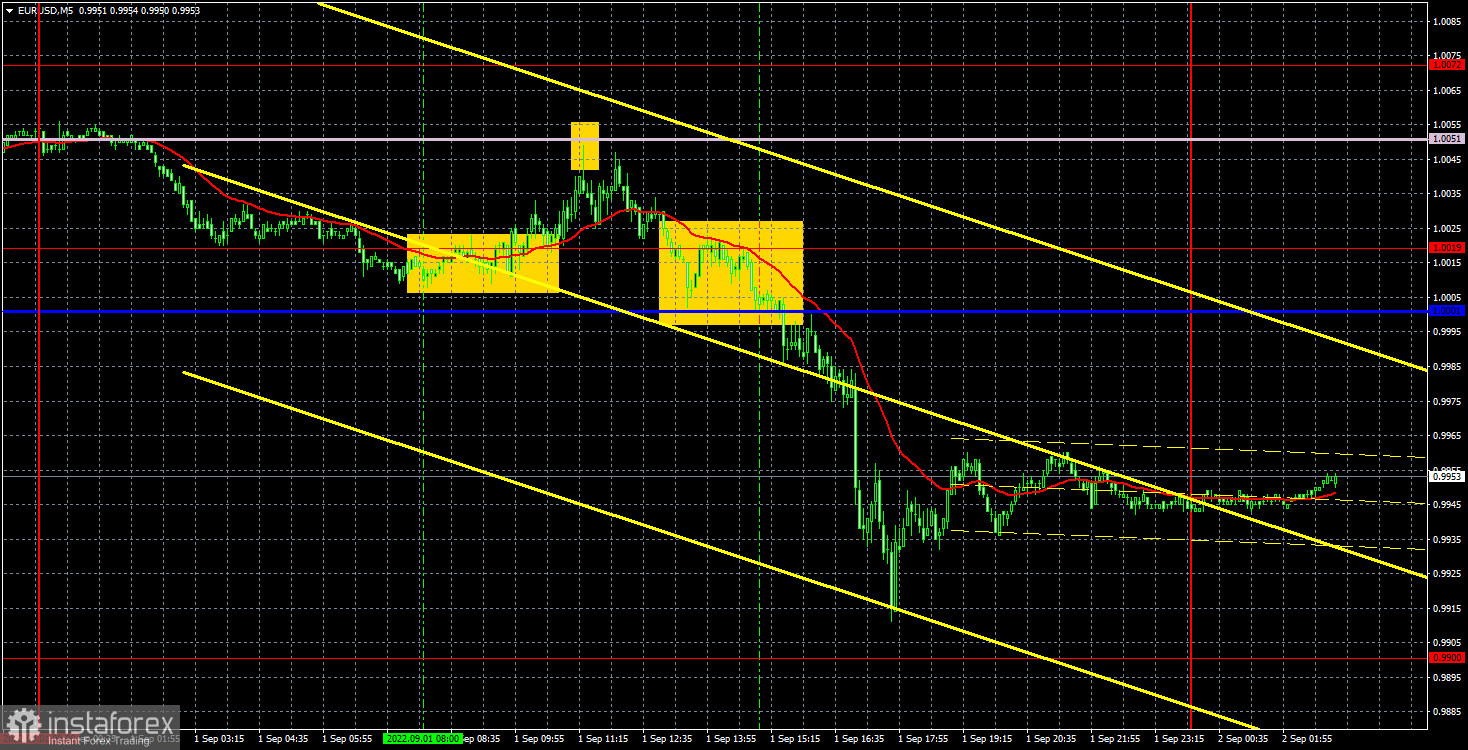
EUR/USD 5M
The EUR/USD pair continued to move in the style already familiar over the past two weeks and the 0.9900-1.0072 channel. Despite the fact that there was a fall of more than 100 points during the day, the pair still remained inside the horizontal channel. Therefore, no new conclusions on the technical picture can be made now. Perhaps the euro will continue to fall (especially if the US statistics are strong), and then the pair will overcome the level of 0.9900. But until this happens, we are stating a fact - a wide flat or "swing" remains. There were only minor reports in the European Union on Thursday. The unemployment rate and the second assessment of the index of business activity in the services sector are not the data that could provoke the euro's collapse. Also not involved in the pair's decline and the ISM business activity index in the US. Thus, the macroeconomic statistics was, in contrast to the previous days of the week, but it had no effect on the course of trading.
In regards to Thursday's trading signals, everything was pretty good. First, a buy signal was formed when the price settled above the extreme level of 1.0019. The upward movement did not last long and ended near the Senkou Span B line. The signal cannot be considered false, since the nearest target level was worked out. Managed to earn 7 points. The sell signal also had to be worked out, and it brought good profit to traders, since the pair, after its formation, went down about 110 points, forming another sell signal near the critical line along the way. The pair did not reach the level of 0.9900 by only a dozen points, the deal had to be closed manually in the late afternoon with a profit of at least 90 points.
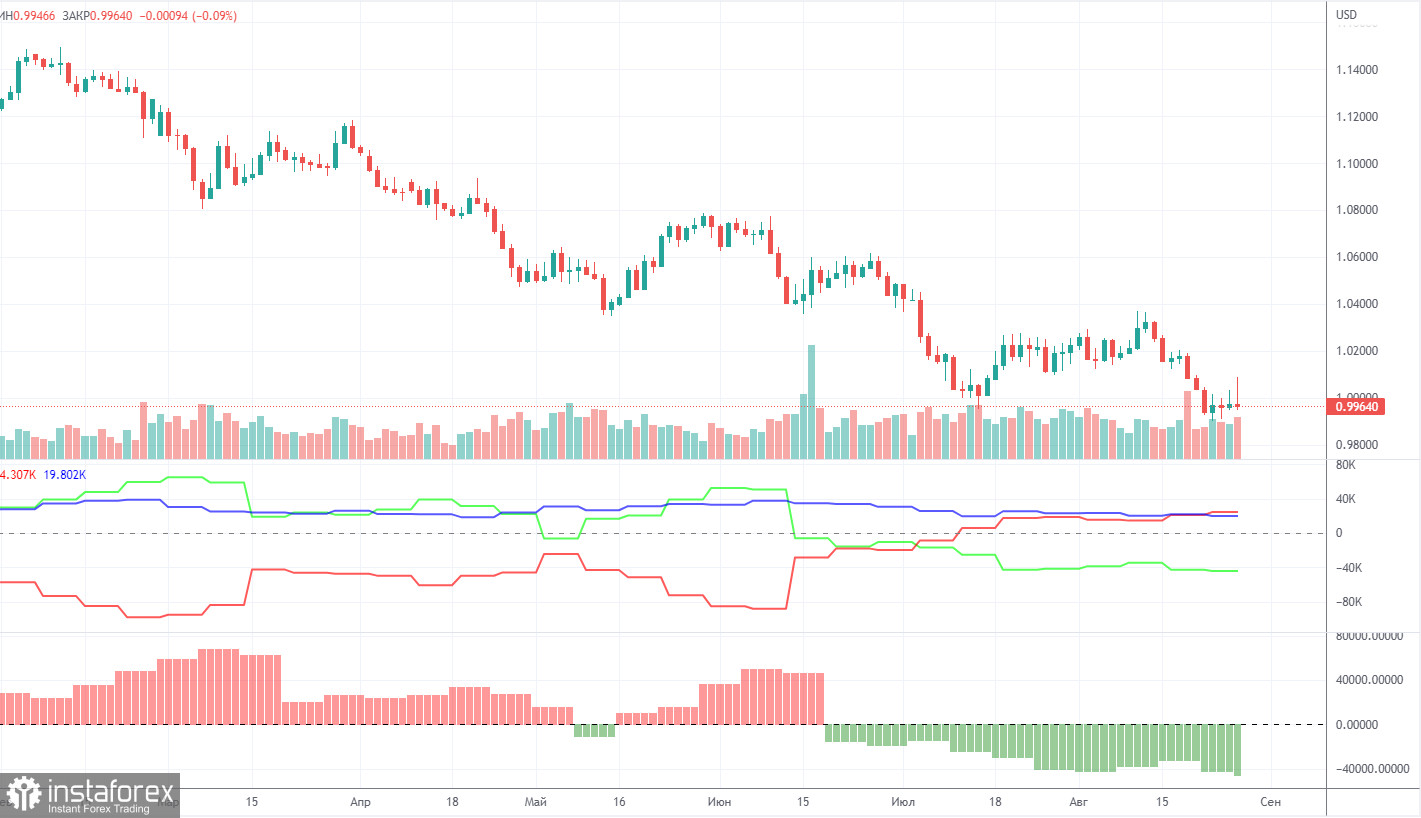
COT report:
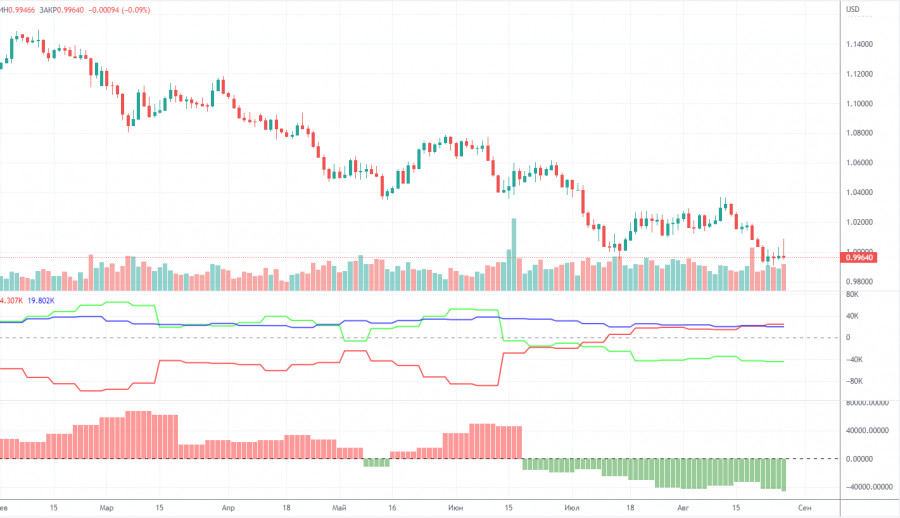
The Commitment of Traders (COT) reports on the euro in the last few months clearly reflect what is happening in the euro/dollar pair. For most of 2022, they showed an openly bullish mood of commercial players, but at the same time, the euro fell steadily at the same time. At this time, the situation is different, but it is NOT in favor of the euro. If earlier the mood was bullish, and the euro was falling, now the mood is bearish and... the euro is also falling. Therefore, for the time being, we do not see any grounds for the euro's growth, because the vast majority of factors remain against it. The number of long positions for the non-commercial group increased by 11,600, and the number of shorts increased by 12,900 during the reporting week. Accordingly, the net position increased by about 1,300 contracts. After several weeks of weak growth, the decline in this indicator resumed, and the mood of major players remains bearish. From our point of view, this fact very eloquently indicates that at this time even commercial traders still do not believe in the euro. The number of longs is lower than the number of shorts for non-commercial traders by 44,000. Therefore, we can state that not only does the demand for the US dollar remain high, but that the demand for the euro is also quite low. The fact that major players are in no hurry to buy the euro may lead to a new, even greater fall. Over the past six months or a year, the euro has not been able to show even a tangible correction, not to mention something more.
We recommend to familiarize yourself with:
Overview of the EUR/USD pair. September 2. The euro has nothing to hope for and nowhere to expect help.
Overview of the GBP/USD pair. September 2. The pound continues to slide downhill.
Forecast and trading signals for GBP/USD on September 2. Detailed analysis of the movement of the pair and trading transactions.
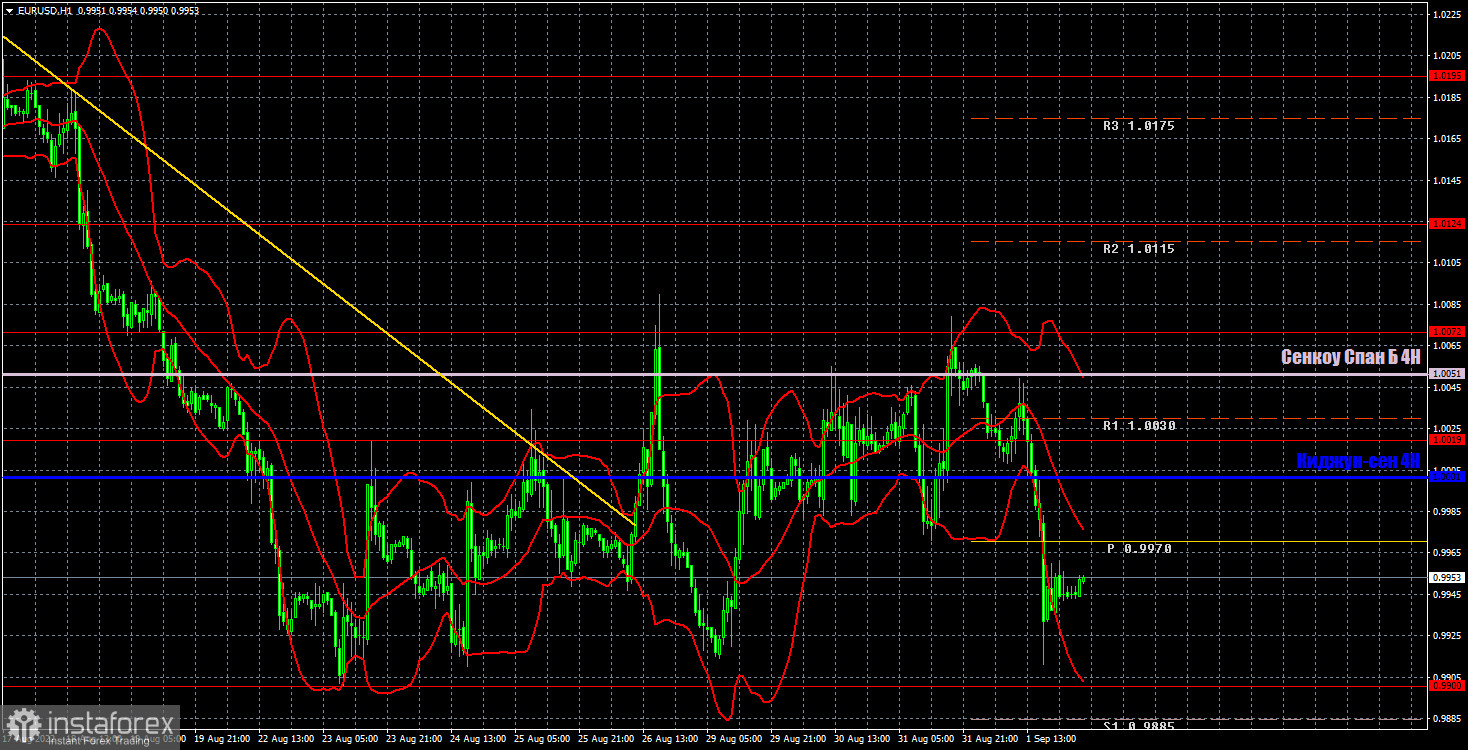
EUR/USD 1H
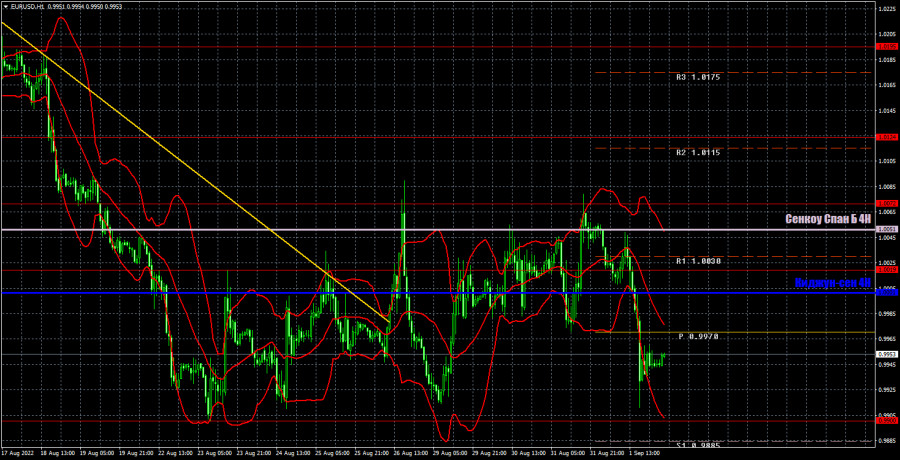
The pair continues to be inside the 0.9900-1.0072 channel on the hourly timeframe. If the bears manage to gain a foothold below it, then it will be possible to count on the resumption of the global downward trend. Otherwise, the "swing" will remain. We highlight the following levels for trading on Friday - 0.9900, 1.0019, 1.0072, 1.0124, 1.0195, 1.0269, as well as Senkou Span B (1.0051) and Kijun-sen (1.0001). There is not a single level below 0.9900, so there is simply nothing to trade there. Ichimoku indicator lines can move during the day, which should be taken into account when determining trading signals. There are also secondary support and resistance levels, but no signals are formed near them. Signals can be "rebounds" and "breakthrough" extreme levels and lines. Do not forget about placing a Stop Loss order at breakeven if the price has gone in the right direction for 15 points. This will protect you against possible losses if the signal turns out to be false. There will again not be a single important event in the European Union on September 2, but we have as many as three important reports in the United States. Of course, the NonFarm Payrolls report will be of most interest. We are waiting for the market reaction to it, two other reports (wages and unemployment) are important, but more secondary.
Explanations for the chart:
Support and Resistance Levels are the levels that serve as targets when buying or selling the pair. You can place Take Profit near these levels.
Kijun-sen and Senkou Span B lines are lines of the Ichimoku indicator transferred to the hourly timeframe from the 4-hour one.
Support and resistance areas are areas from which the price has repeatedly rebounded off.
Yellow lines are trend lines, trend channels and any other technical patterns.
Indicator 1 on the COT charts is the size of the net position of each category of traders.
Indicator 2 on the COT charts is the size of the net position for the non-commercial group.