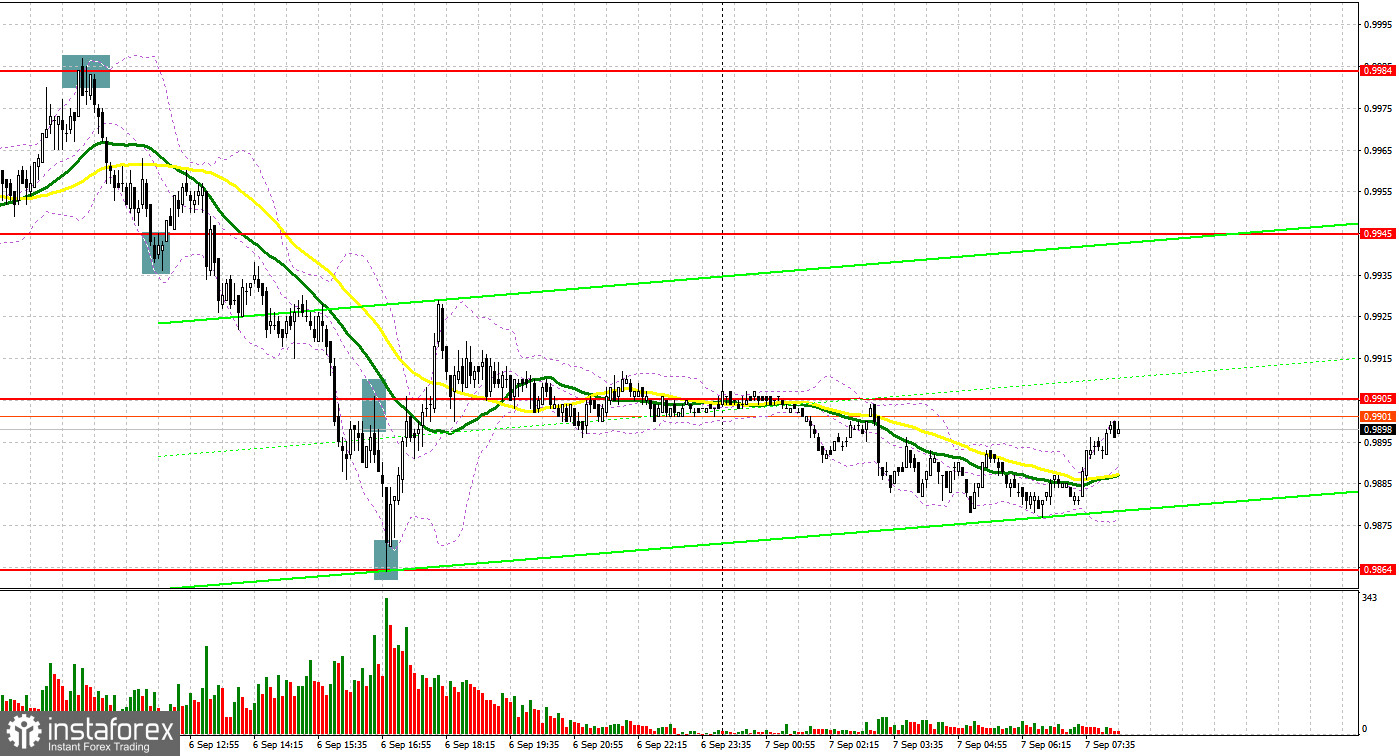
Yesterday, traders received several signals to enter the market, which allowed them to make a profit. Let us take a look at the 5-minute chart to figure out what happened in the market. Earlier, I asked you to pay attention to the level of 0.9984 to decide when to enter the market. Quite weak data from Germany had an indirect effect on the European currencies. A false breakout of 0.9984 and buyers' failure to go above this level led to a sell signal, thus causing a massive sell-off. As a result, the pair declined by 40 pips. Bulls made an attempt to gain control over the market and formed buy signals near 0.9941. However, the pair increased only by 15 pips, then strong data from the US returned pressure on the pair. A breakout and an upward test of 0.9905 gave an additional sell signal. As a result, the pair dropped by another 40 pips. Buy orders after a rebound from 0.9864 gave another 40 pips in profit.
Conditions for opening long positions on EUR/USD:
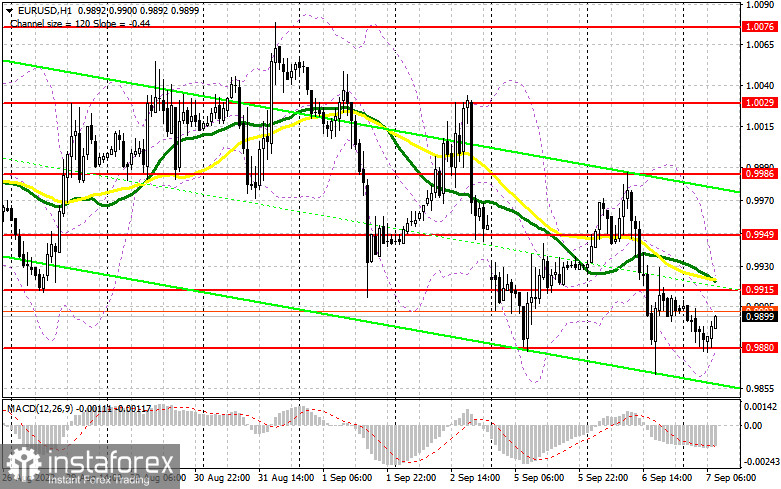
Since trading is performed near another yearly low, it is difficult to find a reason for a rise in the euro. Until tomorrow's ECB meeting, the bearish market will hardly change for the bullish one. In the first part of the day, traders should pay attention to Germany's industrial production. However, data on its GDP growth rate for the third quarter will be of higher importance. If the indicator declines, pressure on the euro will only increase. The same report will be published in the eurozone. Economists may upwardly revise the GDP outlook. The unemployment rate should meet the previous figures. It will be better to buy the euro near a new support level of 0.9880, formed at the end of yesterday's Asian trade. A false breakout of 0.9880 will give an entry point with the target at 0.9915. Slightly above this area, there are sellers' moving averages. Strong data from Germany and the eurozone as well as a breakout and a downward test of this level will affect bears' stop orders, thus forming an additional buy signal with the target at 0.9949. The next target is located at the resistance level of 0.9986, which is an upper limit of the wide downward channel, where it is recommended to lock in profits. If the euro/dollar pair declines and buyers fail to protect 0.9880, pressure on the pair will return. In this event, it will be wise to go long after a false breakout of the new yearly low of 1.9849. Traders may also buy the asset just after a bounce off 0.9819 or even lower – from 0.9770, expecting an upward correction of 30-35 pips.
Conditions for opening short positions
Bears are fully controlling the market. The recent bulls' attempts to reach the parity level were to no avail. Sellers should primarily protect the nearest resistance level of 0.9915. The price climbed to this level after the publication of the data in Germany and the eurozone. That is why a false breakout of this level will lead to a perfect sell signal with the target at 0.9880. A breakout and consolidation below this level and an upward test will give an additional signal, which may affect buyers' stop orders. In this case, the pair may slide to 0.9849 and 0.9819, where it is recommended to lock in profits. The next target is located at the low of 0.9770. If the euro/dollar pair increases during the European session and bears fail to protect 0.9915, the situation will hardly change considerably. However, the pair may start gaining in value ahead of tomorrow's ECB meeting. Against the backdrop, it will be better to avoid sell orders until the price hits 0.9949, but only after a false breakout. Traders may sell the asset after a rebound from the high of 0.9986 or even higher – from 1.0029, expecting a decline of 30-35 pips.
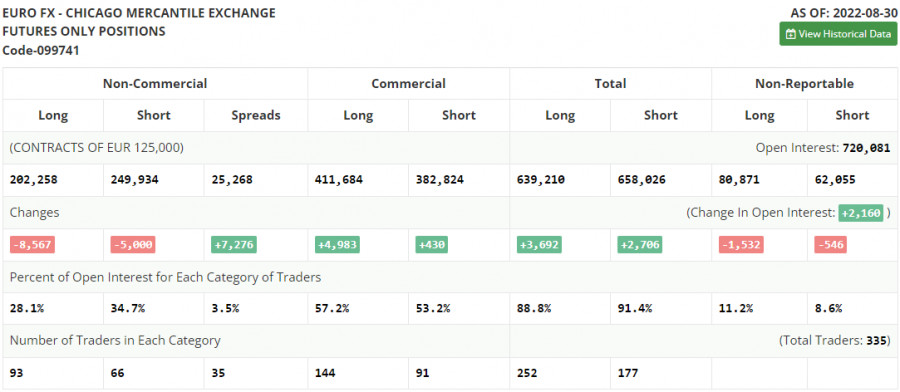
COT report
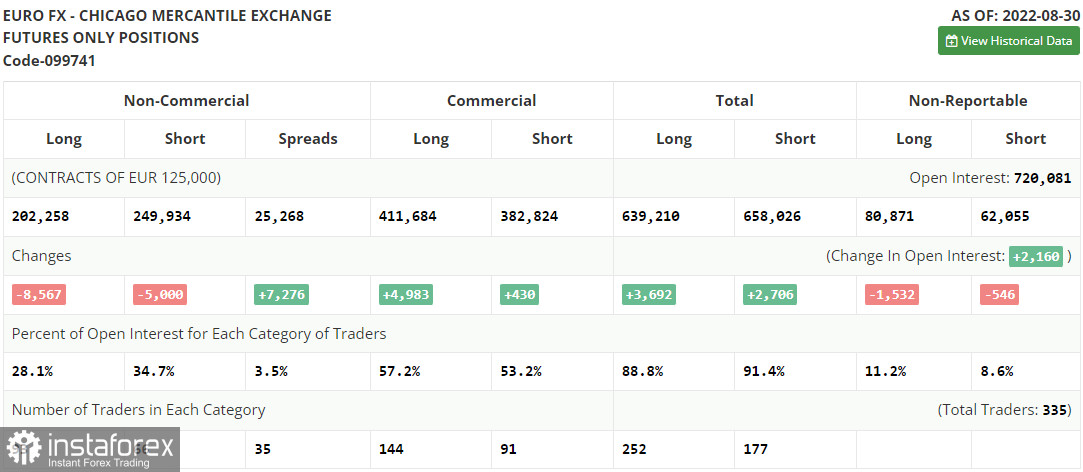
According to the COT report from August 30, the number of both short and long positions dropped. A week ago, trading activity surged, but now it is gradually falling. This also signals a decrease in risk appetite after the release of the eurozone CPI data. The report unveiled a surge to a fresh high. The market sentiment also turned sour due to the ongoing energy crisis. Russia's halt in supplies through its key pipeline may cause another increase in energy prices this winter. If the predictions come true, inflation may show a considerable jump, thus forcing the ECB to raise interest rates more aggressively. This week, the ECB is going to announce its key rate decision, which may weaken the euro against the US dollar. Although a rate hike may stir up EU Treasury bond yields, there is also a likelihood of a slowdown in economic growth. That is why the euro will hardly recover in the medium term. The COT report revealed that the number of long non-commercial positions decreased by 8,567 to 202,258, whereas the number of short non-commercial positions decreased by 5,000 to 249,934. At the end of the week, the total non-commercial net position remained negative and dropped to -47,676 against -44,109. Apparently, bears are still holding the upper hand. Therefore, the euro is likely to fall even deeper. The weekly closing price inched up to 1.0033 from 0.9978.
Signals of indicators:
Moving Averages
Trading is performed below 30- and 50-day moving averages, which points to a deeper decline in the pair.
Note: The period and prices of moving averages are considered by the author on the one-hour chart, which differs from the general definition of the classic daily moving averages on the daily chart.
Bollinger Bands
If the pair decreases, the support level will be located at the lower limit of the indicator near 0.9880. In case of a rise, the upper limit of the indicator located at 0.9915 will act as resistance.
Description of indicators
- Moving average (moving average, determines the current trend by smoothing volatility and noise). The period is 50. It is marked in yellow on the chart.
- Moving average (moving average, determines the current trend by smoothing volatility and noise). The period is 30. It is marked in green on the graph.
- MACD indicator (Moving Average Convergence/Divergence - convergence/divergence of moving averages). A fast EMA period is 12. A slow EMA period is 26. The SMA period is 9.
- Bollinger Bands. The period is 20.
- Non-profit speculative traders are individual traders, hedge funds, and large institutions that use the futures market for speculative purposes and meet certain requirements.
- Long non-commercial positions are the total number of long positions opened by non-commercial traders.
- Short non-commercial positions are the total number of short positions opened by non-commercial traders.
- The total non-commercial net position is a difference in the number of short and long positions opened by non-commercial traders.