یہ حصّہ انسٹا فاریکس کے ساتھ تجارت کے بارے میں سب سے اہم معلومات فراہم کرتا ہے۔ ہم تجربہ کار تاجروں کے لیے سرکردہ ماہرین کے تجزیات اور نیاء شروع کرنے والوں کے لیے تجارتی حالات پر مضامین دونوں فراہم کرتے ہیں۔ ہماری خدمات آپ میں نفع صلاحیت کو بڑھانے میں مدد کریں گار ہوںگی
نیز ملاحظہ کریں
یہ حصّہ اُن لوگوں کے لیے تیار کیا گیا ہے جو ابھی اپنا تجارتی سفر شروع کر رہے ہیں۔ انسٹا فاریکس کا تعلیمی اور تجزیاتی مواد آپ کی تربیتی ضروریات کو پورا کرے گا۔ ہمارے ماہرین کی سفارشات تجارتی کامیابی کے لیے آپ کے ابتدائی اقدامات کو آسان اور واضح بنا دیں گی
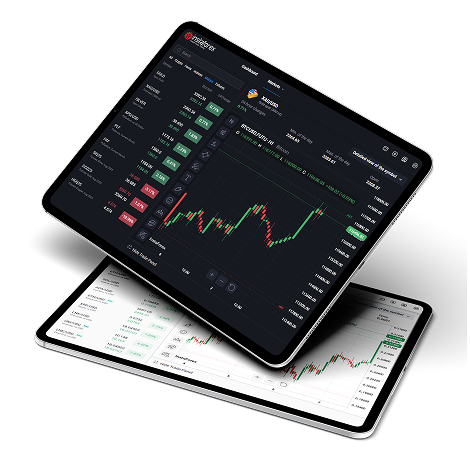
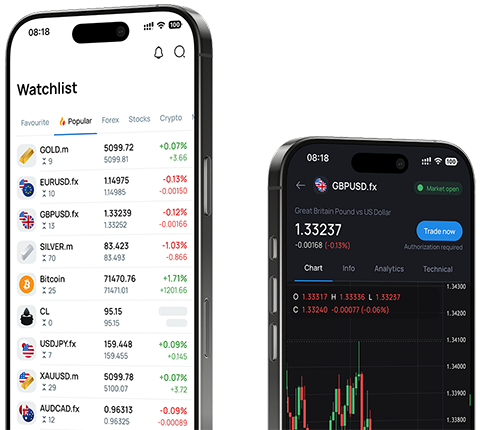
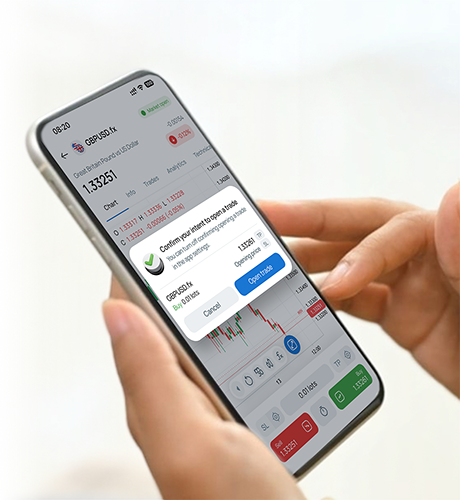
انسٹا فاریکس کی جدید خدمات پیداواری سرمایہ کاری کا ایک لازمی عنصر ہیں۔ ہم اپنے صارفین کو جدید تکنیکی صلاحیتیں فراہم کرنے اور ان کے تجارتی معمولات کو سہل بنانے کے لئے کوشاں ہیں کیونکہ ہمیں اس سلسلے میں بہترین بروکر کے طور پر جانا جاتا ہے۔
انسٹا فاریکس کے ساتھ شراکت فائدہ مند اور اعلیٰ درجے کی ہے۔ ہمارے ملحقہ پروگراموں میں شامل ہوں اور بونس، پارٹنر انعامات اور عالمی شہرت یافتہ برانڈ کی ٹیم کے ساتھ سفر کرنے کے امکانات سے لطف اندوز ہوں۔
یہ حصّہ انسٹا فاریکس کی جانب سے سب سے زیادہ منافع بخش پیشکشوں پر مشتمل ہے۔ کسی اکاؤنٹ میں رقم جمع کروانے پر بونس حاصل کریں، دوسرے تاجروں سے مقابلہ کریں، اور ڈیمو اکاؤنٹ میں ٹریڈنگ کرتے وقت بھی حقیقی انعامات حاصل کریں۔
انسٹا فاریکس کے ساتھ تعطیلات نہ صرف خوشگوار بلکہ سود مند بھی ہیں۔ ہم ایک ون اسٹاپ پورٹل، متعدد فورمز، اور کارپوریٹ بلاگز پیش کرتے ہیں، جہاں تاجران تجربات کا تبادلہ کر سکتے ہیں اور فاریکس کمیونٹی میں کامیابی سے شامل ہو سکتے ہیں۔
انسٹا فاریکس ایک بین الاقوامی برانڈ ہے جسے 2007 میں بنایا گیا تھا۔ کمپنی آن لائن ایف ایکس ٹریڈنگ کے لیے خدمات فراہم کرتی ہے اور اسے دنیا کے معروف بروکرز میں سے ایک جانا جاتا ہے۔ ہم نے سے زیادہ ریٹیل تاجران 7,000,000کا اعتماد جیت لیا ہے، جنہوں نے پہلے ہی ہمارے بھروسہ کو سراہا ہے اور اختراعات پر توجہ مرکوز کی ہے۔