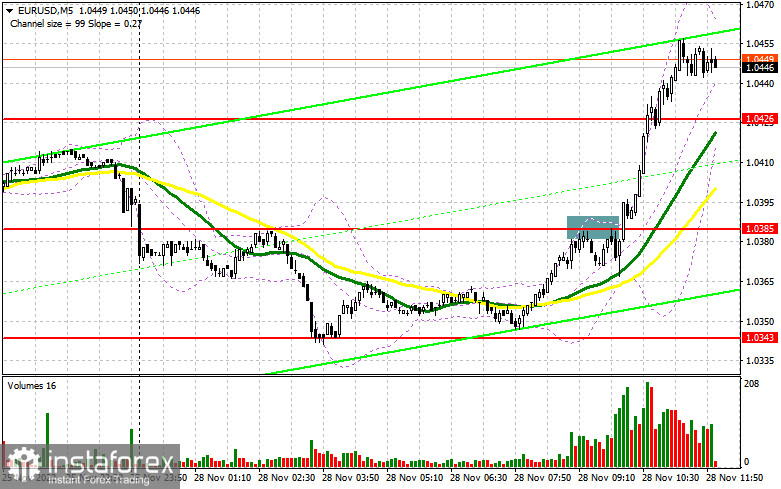
In my morning review, I mentioned the level of 1.0385 and recommended entering the market from there. Let's analyze the pair on the 5-minute chart. A rise to this level and its false breakout formed a sell signal in the first half of the day. However, the pair failed to develop a proper downtrend. So, after the third attempt, bulls managed to break higher, thus urging traders to close losing trades. No other entry points were formed in the morning. In the afternoon, the technical setup changed, just like the strategy.
For long positions on EUR/USD:
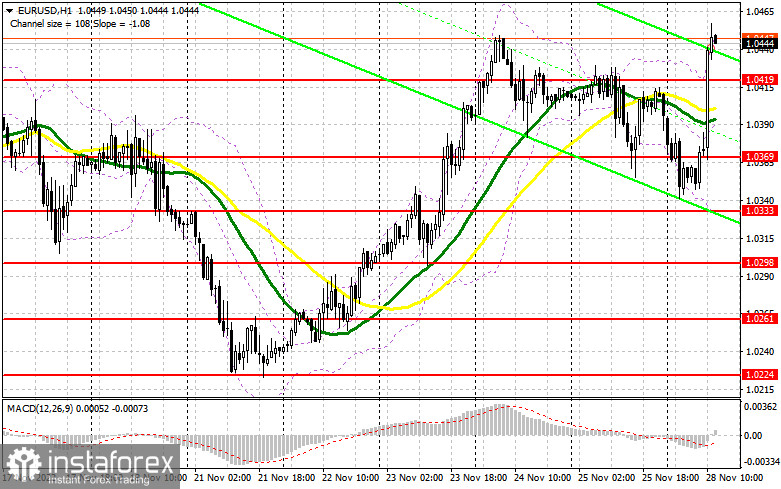
Today, it is recommended to trade within the sideways channel, given that the US has no fundamental reports to present in the afternoon apart from the statements by the Fed members. If John C. Williams and James Bullard give new details, saying, for example, that the Fed is not going to slow the pace of rate hikes, the euro will come under pressure and the pair will drop in the second half of the day. If so, it is better to focus on the nearest support at 1.0419 that was formed in the European session. A false breakout will generate a buy signal with a prospect of a further advance to the monthly high of 1.0475. A breakout of this range and its downward retest will reinforce the bullish bias and will pave the way to the next target at 1.0525. If the price climbs above this level, it may develop a strong upward movement towards 1.0568 where I recommend profit taking. In case EUR/USD declines in the New York session and bulls are idle at 1.0419, the euro will weaken and the pair will drop again. If so, buying the pair will be possible only after a false breakout of the 1.0369 support level where moving averages supporting the bulls are found. Going long on EUR/USD right after a rebound is advisable only from the level of 1.0333 or even from the low of 1.0298, keeping in mind a possible upside correction of 30-35 pips within the day.
For short positions on EUR/USD:
In case FOMC officials agree that the Fed should slow down the pace of monetary tightening, the euro may break above the monthly high, thus starting a new upward cycle of the instrument. The best moment to sell the pair will be a false breakout at 1.0475 which will serve as an entry point. At this level, the euro may start to decline towards the support at 1.0419 that was formed in the first half of the day. Consolidation near this level and its upward retest will create an additional sell signal that will trigger stop-loss orders set by the buyers. If so, the euro may fall to 1.0369 where I recommend profit taking. The next downward target will be the level of 1.0333 where the bullish run may stall and the price may get stuck in the sideways channel. If EUR/USD rises in the course of the North American session and bears are idle at 1.0475, speculative sellers will start leaving the market. This will reinforce the bullish presence and will help them resume the uptrend by opening the way to 1.0525. At this point, selling the pair should be done only after a false breakout. Going short on EUR/USD right after a rebound is advisable from the high of 1.0568, bearing in mind a downside correction of 30-35 pips within the day.
COT report
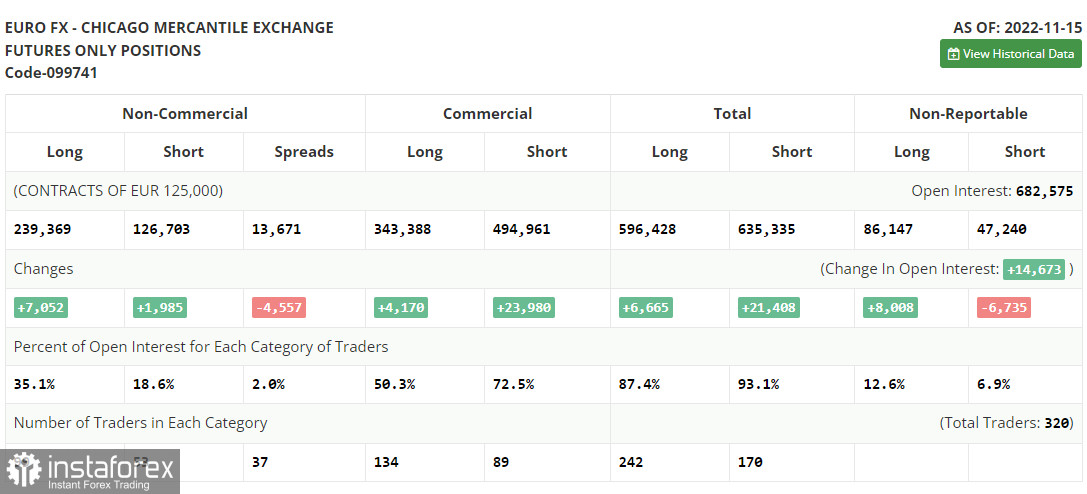
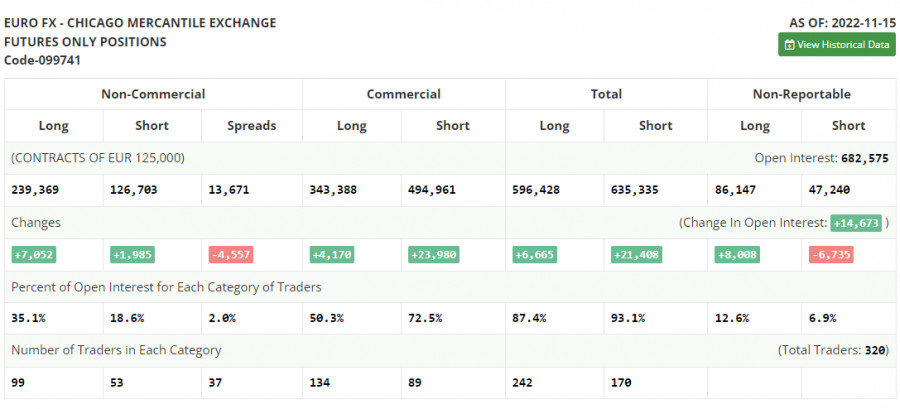
The Commitments of Traders report for November 15 showed a rise in both short and long positions. There have been speculations lately that the Fed may ease its current aggressive monetary policy starting this December. At the same time, these assumptions contrast with the recent US retail sales data revealing that the indicator increased in October. Moreover, the report has surpassed all forecasts, clearly indicating that inflationary pressures remain strong at the end of the year. Therefore, the recent CPI report from the US demonstrating a slowdown in prices should be taken with caution. Apparently, the US Federal Reserve will stick to its plan and will keep raising rates. As for the euro, the demand for risk assets has indeed increased. However, amid the recent GDP data in the eurozone, the euro/dollar pair is very unlikely to perform a strong upward movement until the end of the year. According to the COT report, long positions of the non-commercial group of traders increased by 7,052 to 239,369 while short positions rose by 1,985 to 126,703. The non-commercial net position remained positive and stood at 112,666 compared to 107,599 a week ago. This indicates that investors are taking advantage of a cheaper euro and continue to buy it even though it is holding above the parity level. They might also be accumulating long positions in hope that the pair will start to recover sooner or later. The weekly closing price advanced to 1.0390 from 1.0104.
Indicator signals:
Moving Averages
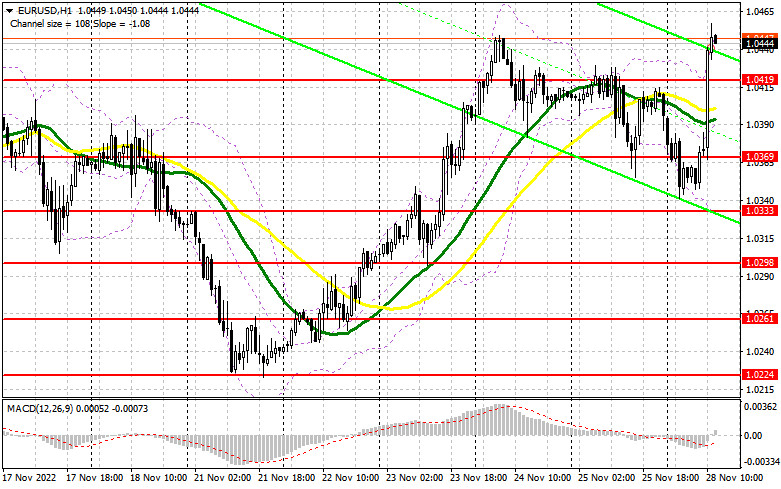
Trading above the 30- and 50-day moving averages indicates that bulls are prevailing in the market.
Please note that the time period and levels of the moving averages are analyzed only for the H1 chart, which differs from the general definition of the classic daily moving averages on the D1 chart.
Bollinger Bands
In case of a decline, the lower band of the indicator at 1.0333 will serve as support.
Description of indicators:
• A moving average of a 50-day period determines the current trend by smoothing volatility and noise; marked in yellow on the chart;
• A moving average of a 30-day period determines the current trend by smoothing volatility and noise; marked in green on the chart;
• MACD Indicator (Moving Average Convergence/Divergence) Fast EMA with a 12-day period; Slow EMA with a 26-day period. SMA with a 9-day period;
• Bollinger Bands: 20-day period;
• Non-commercial traders are speculators such as individual traders, hedge funds, and large institutions who use the futures market for speculative purposes and meet certain requirements;
• Long non-commercial positions represent the total number of long positions opened by non-commercial traders;
• Short non-commercial positions represent the total number of short positions opened by non-commercial traders;
• The non-commercial net position is the difference between short and long positions of non-commercial traders