empty
 
 
09.12.2022 07:36 AM
Forecast and trading signals for GBP/USD on December 9, 2022. COT report. Detailed analysis of price movement and trades

M5 chart of GBP/USD

This image is no longer relevant

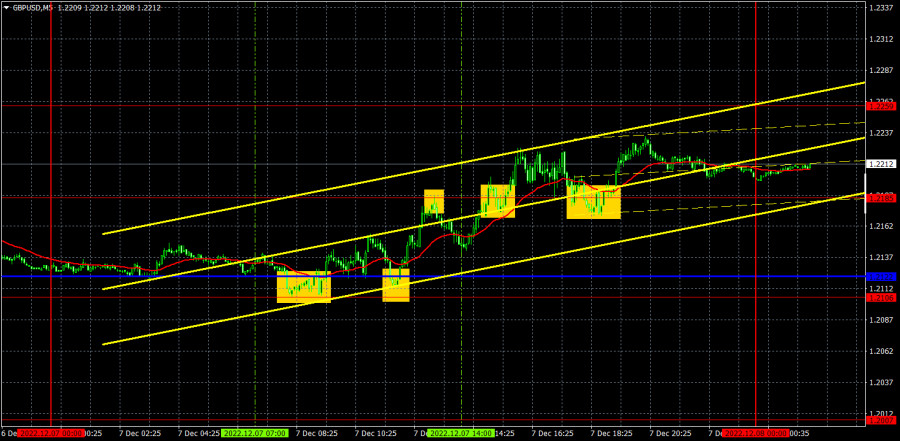
On Thursday, GBP/USD traded higher but failed to break through the critical line. Therefore, a downtrend may resume with the target at the Senkou Span B. The pair's volatility has decreased this week. Its movements have been chaotic, which made it quite difficult to trade, with signals being either weak or false. Traders have started to ignore the lines of the Ichimoku indicator, which may indicate an impending flat. On Thursday, there was not a single report or event, able to influence the market.

A lot of trading signals were generated yesterday but they were mostly false. In the M5 time frame, the first three signals were made near the extreme level of 1.2185. The first two signals turned out to be false. Consequently, there was no point in opening a position after the third signal. Further, several signals were produced near the critical line. Still, they were also partially false. All in all, yesterday's trading brought insignificant losses.

COT report:

This image is no longer relevant

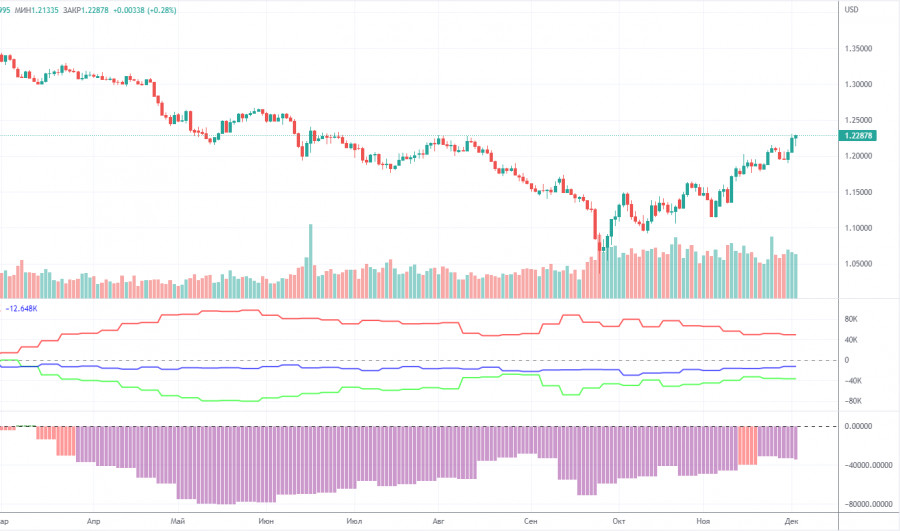
The latest COT report showed an increase in bearish sentiment for the second straight week. During the reporting week, non-commercial traders closed 5,000 long positions and 4,000 short ones. The net position dropped by 1,000. The figure has been on the rise for several months. Nevertheless, sentiment remains bearish, and the pound is on the rise against the greenback for no reason. We assume that the pair may well resume the downtrend soon. Notably, both GBP/USD and EUR/USD now show practically identical movement. At the same time, the net position on EUR/USD is positive and negative on GBP/USD. Non-commercial traders now hold 62,000 sell positions and 28,500 long ones. The gap between them is quite wide. As for the total number of open longs and shorts, the bulls have an advantage here by 13,000. Technical factors indicate that the pound may move in an uptrend in the long term. At the same time, fundamental and geopolitical factors signal that the currency is unlikely to strengthen significantly.

H1 chart of GBP/USD

This image is no longer relevant

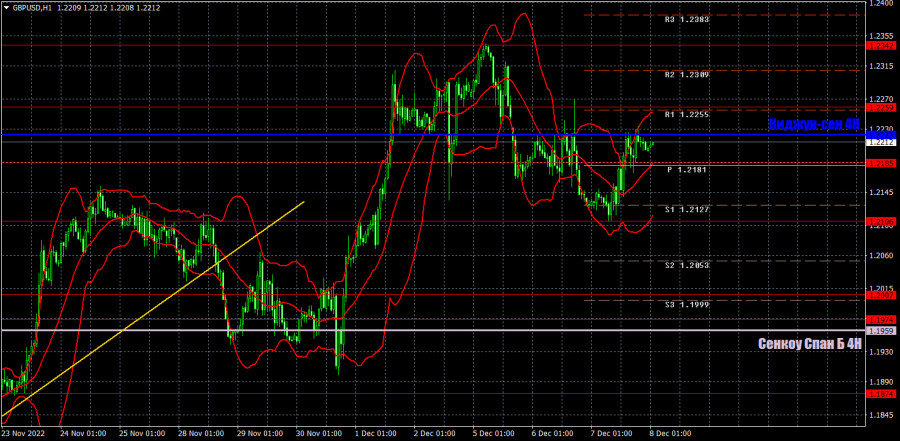
In the H1 time frame, GBP/USD keeps trading noticeably higher. It remains to be seen whether the pair settles above the critical line. If it does, the uptrend may resume. Otherwise, the price may fall to the Senkou Span B. This week, the pair may also be flat, as the H4 time frame shows. On Friday, trading levels are seen at 1.1760, 1.1874, 1.1974-1.2007, 1.2106, 1.2185, 1.2259, 1.2342, 1.2429-1.2458 as well as 1.2041 (Senkou Span B) and 1.222 (Kijun-sen). Signals are made whenever the price bounces or breaks through these levels and lines. Don't forget to place a stop-loss order at the breakeven point when the price passes 20 pips in the right direction. Ichimoku indicator lines can move during the day, which should be taken into account when determining trading signals. There are also support and resistance that can be used for profit-taking. On Monday, the macroeconomic calendar contains no important releases in the UK. The US will see the release of the Michigan consumer sentiment index, which will be published by the end of the day when it is already time to think about closing trades and leaving the market.

Indicators on charts:

Resistance/support - thick red lines, near which the trend may stop. They do not make trading signals.

The Kijun-sen and Senkou Span B lines are the Ichimoku indicator lines moved to the hourly timeframe from the 4-hour timeframe. They are also strong lines.

Extreme levels are thin red lines, from which the price used to bounce earlier. They can produce trading signals.

Yellow lines are trend lines, trend channels, and any other technical patterns.

Indicator 1 on the COT chart is the size of the net position of each trader category.

Indicator 2 on the COT chart is the size of the net position for the Non-commercial group of traders.

Paolo Greco,
انسٹافاریکس کا تجزیاتی ماہر
© 2007-2023
EURUSD
Euro vs US Dollar
ٹائم فریم منتخب کریں
5
منٹ
15
منٹ
30
منٹ
1
گھنٹہ
4
گھنٹے
1
دن
1
ہفتہ
تجارت شروع کریں
تجارت شروع کریں
  • Grand Choice
    Contest by
    InstaForex
    InstaForex always strives to help you
    fulfill your biggest dreams.
    مقابلہ میں شامل ہوں
  • چانسی ڈیپازٹ
    اپنے اکاؤنٹ میں 3000 ڈالر جمع کروائیں اور حاصل کریں$8000 مزید!
    ہم مارچ قرعہ اندازی کرتے ہیں $8000چانسی ڈیپازٹ نامی مقابلہ کے تحت
    اپنے اکاؤنٹ میں 3000 ڈالر جمع کروانے پر موقع حاصل کریں - اس شرط پر پورا اُترتے ہوئے اس مقابلہ میں شرکت کریں
    مقابلہ میں شامل ہوں
  • ٹریڈ وائز، ون ڈیوائس
    کم از کم 500 ڈالر کے ساتھ اپنے اکاؤنٹ کو ٹاپ اپ کریں، مقابلے کے لیے سائن اپ کریں، اور موبائل ڈیوائسز جیتنے کا موقع حاصل کریں۔
    مقابلہ میں شامل ہوں
  • 100 فیصد بونس
    اپنے ڈپازٹ پر 100 فیصد بونس حاصل کرنے کا آپ کا منفرد موقع
    بونس حاصل کریں
  • 55 فیصد بونس
    اپنے ہر ڈپازٹ پر 55 فیصد بونس کے لیے درخواست دیں
    بونس حاصل کریں
  • 30 فیصد بونس
    ہر بار جب آپ اپنا اکاؤنٹ ٹاپ اپ کریں تو 30 فیصد بونس حاصل کریں
    بونس حاصل کریں

Recommended Stories

یورو / یو ایس ڈی کا تجارتی منصوبہ برائے 29 مارچ 2023

یورو/ یو ایس ڈی دوبارہ ریزسٹنس حاصل کرنے سے پہلے منگل کو نیویارک دورانیہ میں 1.0845-50 زون تک اوپر گیا تھا ۔ سنگل کرنسی پئیر ابھی جب یہ لکھا

Oscar Ton 08:25 2023-03-29 UTC+2

جی بی پی / یو ایس ڈی: 28 مارچ کو امریکی سیشن کے لیے تجارتی منصوبہ (صبح کے سودوں کا تجزیہ)

میں نے 1.2278 کی سطح پر توجہ مرکوز کی جب میں نے اپنی صبح کی پیشن گوئی کی اور اس کی بنیاد پر تجارتی کارروائیوں کا مشورہ دیا۔ آئیے

Miroslaw Bawulski 19:17 2023-03-28 UTC+2

یورو / یو ایس ڈی: 28 مارچ 2023 کو شمالی امریکہ کے سیشن کے لیے تجارتی منصوبہ۔ صبح کی تجارت کا جائزہ

سابقہ تجزیہ میں، ہم نے 1.0830 کے نشان کے قریب مارکیٹ میں داخل ہونے پر غور کیا۔ آئیے ایم 5 چارٹ کا تجزیہ کرتے ہیں۔ انسٹرومنٹ فروخت کرنے کا اشارہ

Miroslaw Bawulski 18:47 2023-03-28 UTC+2

امریکی ڈالر انڈیکس کا تجارتی منصوبہ برائے 28 مارچ 2023

منگل کو یو ایس ڈالر انڈیکس 102.20 انٹرا ڈے کی طرف گر گیا۔ انڈیکس کو 102.07 کے آس پاس اچھی طرح سے سپورٹ کیا جانا چاہئے جو کہ بالترتیب 101.50

Oscar Ton 14:15 2023-03-28 UTC+2

یورو / یو ایس ڈی: 28 مارچ کو یورپی سیشن کے لیے تجارتی منصوبہ۔ سی او ٹی رپورٹ۔ یورو میں بحالی جاری ہے۔

کل، تاجروں کو مارکیٹ میں داخل ہونے کے کئی اشارے ملے۔ آئیے ہم 5 منٹ کے چارٹ پر ایک نظر ڈالتے ہیں تاکہ یہ معلوم

Miroslaw Bawulski 14:15 2023-03-28 UTC+2

برطانوی پاؤنڈ/امریکی ڈالر: 28 مارچ کو پیش گوئی اور تجارتی اشارے۔ سی او ٹی رپورٹ۔ قیمت کی نقل و حرکت اور تجارت کا تفصیلی تجزیہ۔

پیر کو، برطانوی پاؤنڈ/امریکی ڈالر بھی اوپر کی طرف متوجہ ہوا، لیکن اسی کے ساتھ، یہ مسلسل الٹ گیا اور پورے دن میں واپس نیچے چلا گیا۔ نتیجے

Paolo Greco 12:20 2023-03-28 UTC+2

یورو/امریکی ڈالر: 28 مارچ کو پیش گوئی اور تجارتی اشارے۔ سی او ٹی رپورٹ۔ قیمت کی نقل و حرکت اور تجارت کا تفصیلی تجزیہ۔ یورو کا مقصد بڑھنا ہے۔

پیر کو، یورو/امریکی ڈالر نے اوپر جاتے ہوئے رجحان کی لکیر پر قابو پانے کے باوجود، خاموشی سے اوپر کی طرف حرکت کا ایک نیا دور شروع کیا۔

Paolo Greco 12:18 2023-03-28 UTC+2

یورو / یو ایس ڈی کا تجارتی منصوبہ برائے 28 مارچ 2023

یورو / یو ایس ڈی نے منگل کو 1.0815-20 زون کے یومیہ زون میں ایک تصحیحی اضافہ کیا ہے ہے۔ سنگل کرنسی کو شاید ریزسٹنس کا سامنا کرنا

Oscar Ton 07:55 2023-03-28 UTC+2

برطانوی پاؤنڈ/امریکی ڈالر: 27 مارچ کو پیش گوئی اور تجارتی اشارے۔ سی او ٹی رپورٹ۔ قیمت کی نقل و حرکت اور تجارت کا تفصیلی تجزیہ۔ پاؤنڈ دوبارہ یورو کی پیروی کر رہا ہے۔

جمعہ کو پاؤنڈ نے یورو کی مثال کی پیروی کی۔ یورپی تجارتی سیشن کے آغاز میں برطانوی پاؤنڈ گرنا شروع ہوا۔ لیکن پاؤنڈ کے معاملے میں، یہ منطقی لگتا

Paolo Greco 16:18 2023-03-27 UTC+2

یورو/امریکی ڈالر: 27 مارچ کو پیش گوئی اور تجارتی اشارے۔ سی او ٹی رپورٹ۔ قیمت کی نقل و حرکت اور تجارت کا تفصیلی تجزیہ۔ طویل التوائی تکنیکی اصلاح

جمعہ کے روز، یورو/امریکی ڈالر نے مندی کی اصلاح کی۔ اس سے پہلے، یورو نمایاں طور پر بڑھ رہا تھا، اس لیے اصلاح ناگزیر تھی۔ اور اس حقیقت

Paolo Greco 16:16 2023-03-27 UTC+2
ابھی فوری بات نہیں کرسکتے ؟
اپنا سوال پوچھیں بذریعہ چیٹ.