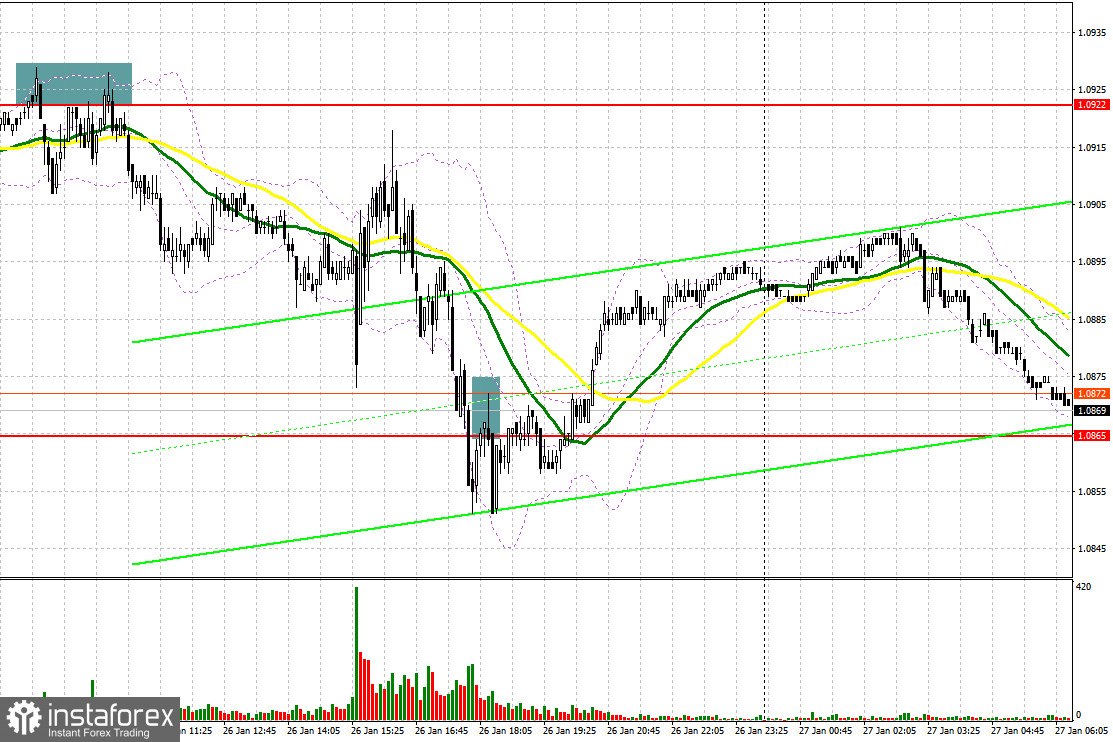
Yesterday, traders received several signals to enter the market. Let us take a look at the 5-minute chart to clear up the market situation. Earlier, I asked you to pay attention to the level of 1.0922 to decide when to enter the market. A rise in the euro to 1.0922 took place amid an empty macroeconomic calendar. After that, the pair formed a false breakout and dropped by more than 50 pips. In the second part of the day, a breakout of 1.0865 and an upward test of this level gave another sell signal but the pair did not show another decline.
Conditions for opening long positions on EUR/USD:
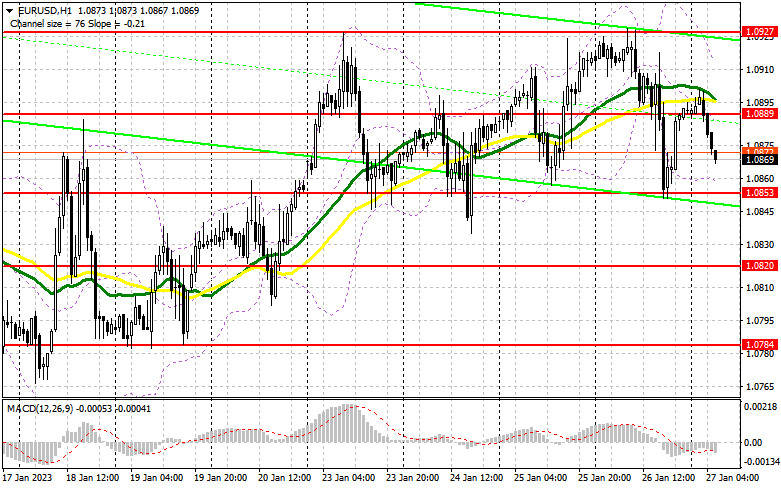
From a technical point of view, the market situation has changed significantly since yesterday. It is obvious that the euro cannot exceed 1.0927 without additional support from big traders. Notably, they have taken the wait-and-see approach ahead of the meetings of central banks, which are scheduled for the next week. Yesterday, a report on the US GDP growth surprised traders. Today, the US will also disclose a bulk of information. However, in the first part of the day, the eurozone will publish its M3 money supply data and public loans figures. However, this information is unlikely to affect the market situation. Meanwhile, Christine Lagarde's hawkish comments may boost the euro above a new resistance level of 1.0889 formed yesterday. However, I will bet on the pair's drop to 1.0853 and open long positions from this level after a false breakout. The target will be located at 1.0889. Slightly above this level, there are bearish MAs. A breakout of this area and a downward test will give an additional buy signal with the target at 1.0927. A breakout of this level will affect bears' stop orders and give an additional opportunity to climb to 12.0970, where it is better to lock in profits. If the euro/dollar pair declines and buyers fail to protect 1.0853 in the first part of the day, the euro may show a more considerable correction. A decline below this level will affect the bullish trend. Only a false breakout near the support level of 1.0820 will give a buy signal. Traders may also go long just after a bounce off the low of 1.0784 or even lower – from 1.0735, expecting a rise of 30-35 pips.
Conditions for opening short positions on EUR/USD:
Yesterday, bears managed to protect the monthly high and pushed the euro to 1.0853. This points to the fact that the pair may stagnate within a sideways channel and slide even deeper. Sellers should regain control over the level of 1.0853. Only this will allow them to build a sideways channel and keep the pair inside it until the first meetings of central banks this year. However, the most important goal is to protect the intermediate resistance level of 1.0889, which is located in the middle of the channel. If the euro/dollar pair jumps during the European session and fail to consolidate above the reached level, traders will get a sell signal with the target at 1.0853. A breakout and a reverse test of 1.0853 will give an additional sell signal with the target at 1.0820. A settlement below this level will lead to a slump to 1.0784. The farthest target is located at 1.0735. If the price tests this level, it is likely to form a downward trend. Traders are better to lock in profits at this level. If the euro/dollar pair increases during the European session and bears fail to protect 1.0889, it is better to remain cautious. Traders should avoid selling until the price touches 1.0927, where it is possible to enter the market after an unsuccessful settlement. Traders may also go short just after a rebound from the high of 1.0970, expecting a decline of 30-35 pips.
COT report
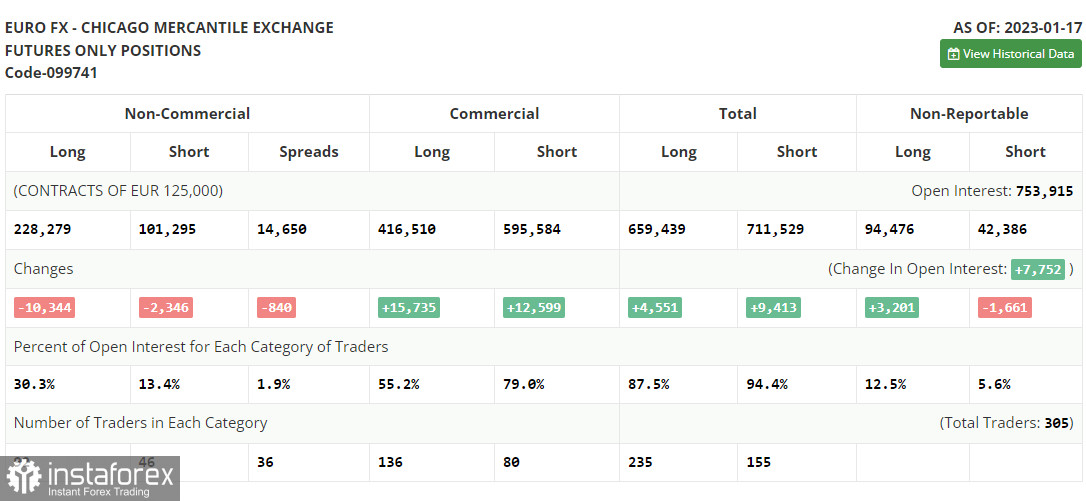
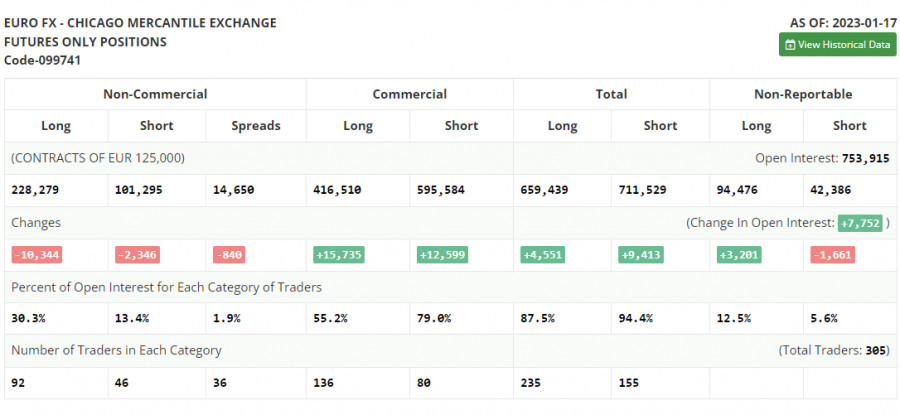
First of all, let us focus on the futures market and changes in the COT report. According to the COT report from January 17, the number of both long and short positions dropped. Traders took the wait-and-see approach after a rapid rise in the euro ahead of the Fed meeting that is scheduled for the next week. Quite weak fundamental data on the US economy, especially a decline in retail sales in December, pointed to the worsening of the overall situation in the country. It means that further monetary policy tightening may lead to even more negative results. On the other hand, inflation continues to slacken, thus allowing the Fed officials to revise the key interest rate hike. Meanwhile, the euro is supported by the ECB's officials who insist on a further key rate hike to combat inflation. Against the backdrop, the euro/dollar pair is reaching new local highs. The COT report unveiled that the number of long non-commercial positions declined by 10,344 to 228,279, while the number of short non-commercial positions slid by 2,346 to 101,295. At the end of the week, the total non-commercial net position decreased to 126,984 from 134,982. All this suggests that investors believe in further growth in the euro but they are still waiting for a clearer picture from central banks on future interest rates. The weekly closing price rose to 1.0833 against 1.0787.
Signals of indicators:
Moving Averages
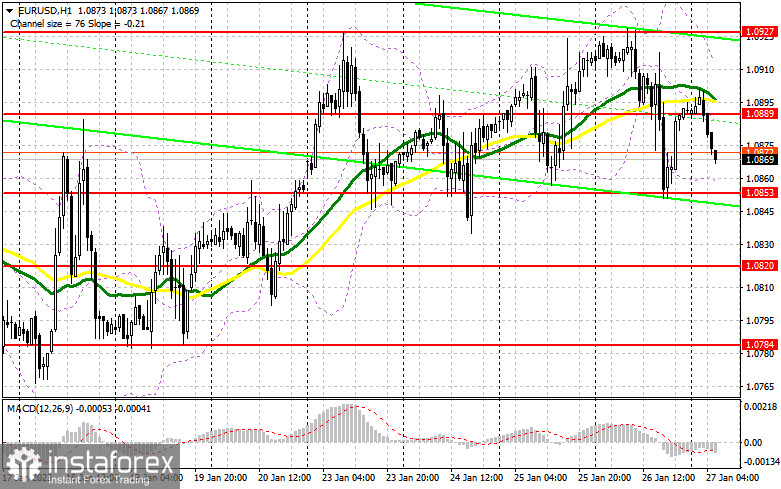
Trading is performed below the 30- and 50-day moving averages, which points to bears' attempt to gain control over the market.
Note: The author considers the period and prices of moving averages on the one-hour chart which differs from the general definition of the classic daily moving averages on the daily chart.
Bollinger Bands
If the pair increases, the resistance level will be formed by the upper limit of the indicator located at 1.0910. In case of a decline, the lower limit of the indicator located at 1.0860 will act as support.
Description of indicators
- Moving average (a moving average determines the current trend by smoothing volatility and noise). The period is 50. It is marked in yellow on the chart.
- Moving average (a moving average determines the current trend by smoothing volatility and noise). The period is 30. It is marked in green on the graph.
- MACD indicator (Moving Average Convergence/Divergence - convergence/divergence of moving averages). A fast EMA period is 12. A slow EMA period is 26. The SMA period is 9.
- Bollinger Bands. The period is 20.
- Non-profit speculative traders are individual traders, hedge funds, and large institutions that use the futures market for speculative purposes and meet certain requirements.
- Long non-commercial positions are the total number of long positions opened by non-commercial traders.
- Short non-commercial positions are the total number of short positions opened by non-commercial traders.
- The total non-commercial net position is a difference in the number of short and long positions opened by non-commercial traders.