Analyzing Wednesday's trades:
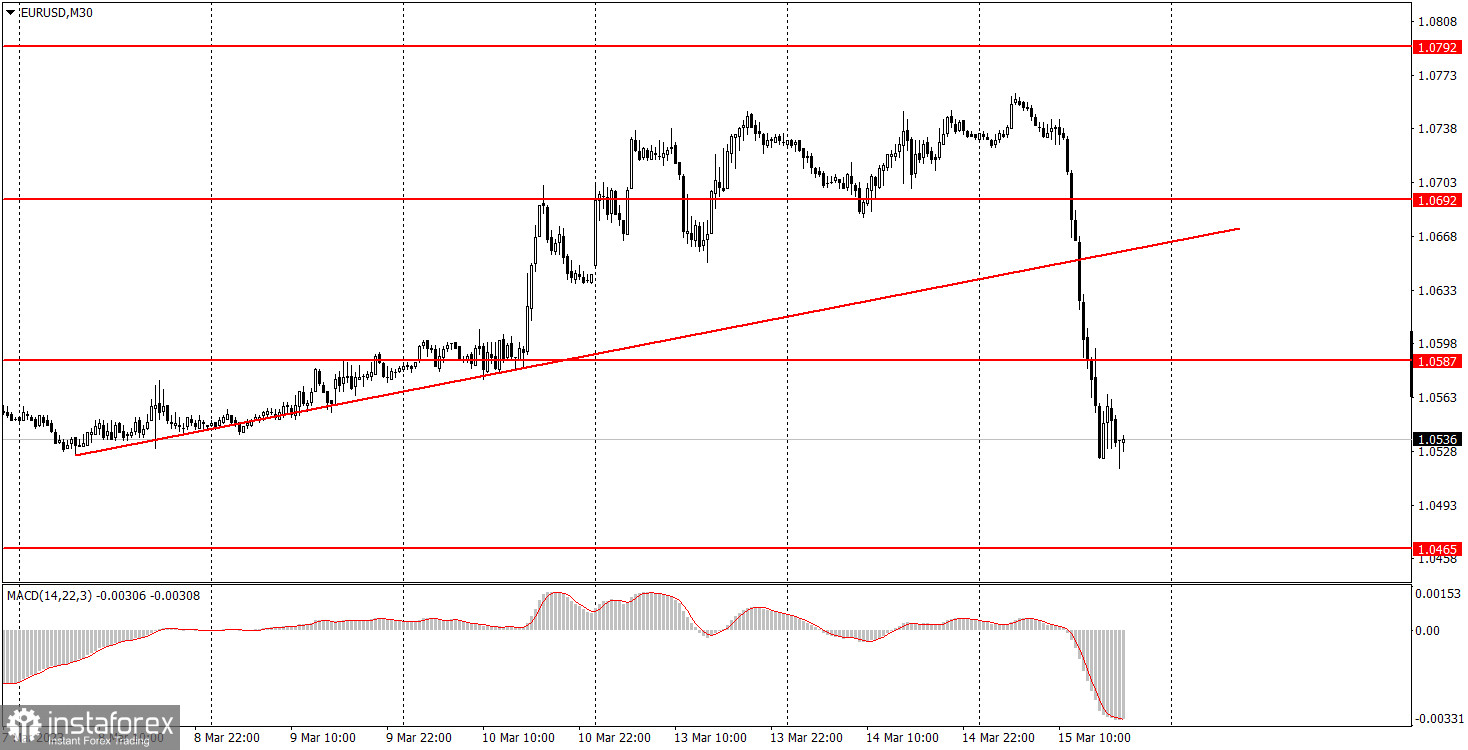
EUR/USD on 30M chart
EUR/USD collapsed on Wednesday. The fall is currently about 200 pips. Naturally, it had to be provoked by something. The results of the European Central Bank meeting will be announced on Thursday, which could play a role, because the rate hike has already been worked off by the market. Today we also found out that Swiss bank Credit Suisse is also facing problems. So far it isn't a matter of bankruptcy, but the market's behavior is comparable to its reaction to the bankruptcy of the two US banks. Last weekend, the market was actively getting rid of the dollar, now the euro. Everything is logical. As for the technical picture, everything is also very simple. I already mentioned that the "swing" will persist in the long term, so we should expect the pair to overcome the trend line and a new round of decline. It turns out that the decline was triggered by a very specific fundamental backdrop, but I think it would have happened anyway. Maybe it just would have been weaker.
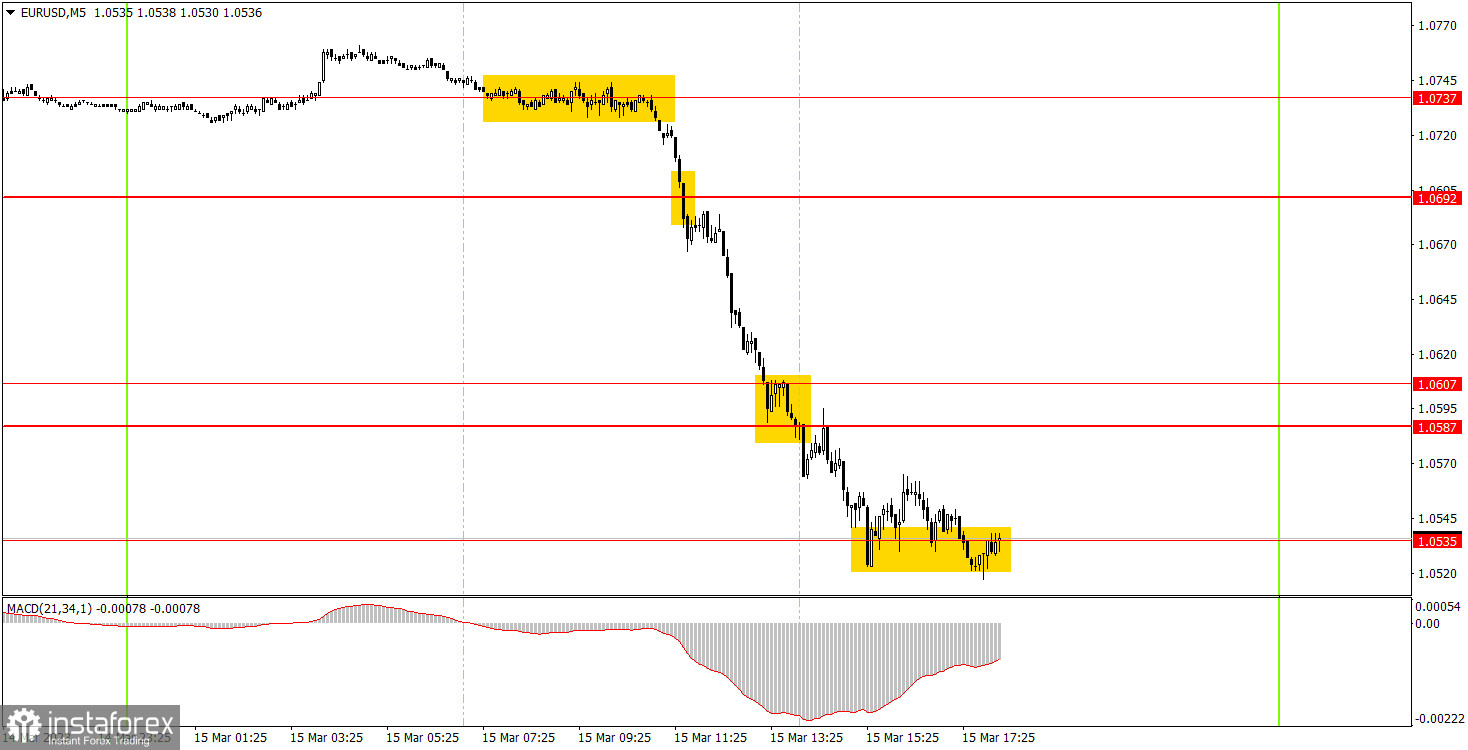
EUR/USD on 5M chart
On the 5-minute chart, you can clearly see how good the day's movement was. The pair moved very volatile and only in one direction during the entire day. Such days make it possible for us to gain a lot of profit, which more than compensates for the losing days (it's good that there aren't many of those). During the European session, there was a sell signal near 1.0737, which was the only deal of the day. The only deal of the day because all the other signals were also sell signals. Eventually the pair fell to 1.0535, from which it bounced. You could close short positions there. The profit made at least 170 pips. Formally, the buy signal could have been executed, but why was it necessary to open a counter-trend trade if the profit of 170 pips was already gained?
Trading tips on Thursday:
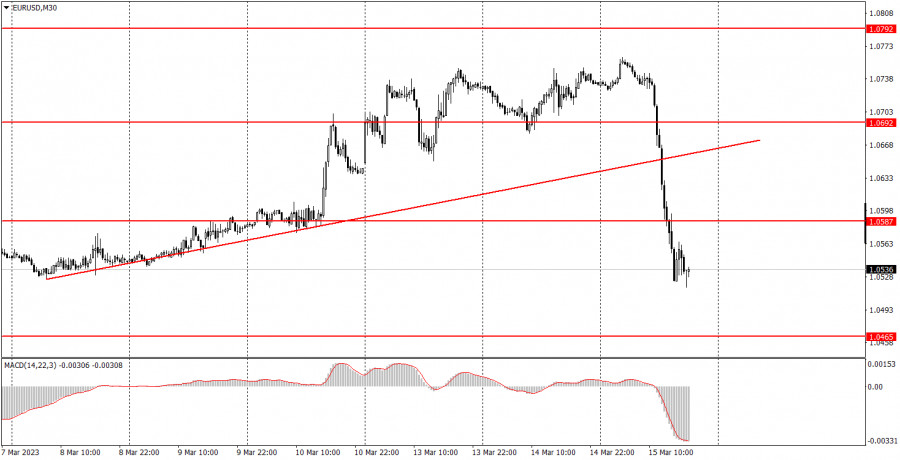
On the 30-minute chart, the pair quickly finished forming a new uptrend. Considering the current fundamental background, EUR/USD can continue falling on Thursday, but there will be a new background in the form of the ECB meeting. Therefore, the pair might trade very volatile again. On the 5-minute chart, it is recommended to trade at the levels 1.0391, 1.0433, 1.0465-1.0483, 1.0535, 1.0587-1.0607, 1.0692, 1.0737, 1.0792, 1.0857-1.0867. As soon as the price passes 15 pips in the right direction, you should set a Stop Loss to breakeven. Only minor reports will be released in the US. In Europe, we have the results of the ECB meeting and ECB President Christine Lagarde's speech. Although the market understands what kind of decision will be made, the reaction might be strong anyway as no one knows what Lagarde will tell the markets.
Basic rules of the trading system:
1) The strength of the signal is determined by the time it took the signal to form (a rebound or a breakout of the level). The quicker it is formed, the stronger the signal is.
2) If two or more positions were opened near a certain level based on a false signal (which did not trigger a Take Profit or test the nearest target level), then all subsequent signals at this level should be ignored.
3) When trading flat, a pair can form multiple false signals or not form them at all. In any case, it is better to stop trading at the first sign of a flat movement.
4) Trades should be opened in the period between the start of the European session and the middle of the US trading hours when all positions must be closed manually.
5) You can trade using signals from the MACD indicator on the 30-minute time frame only amid strong volatility and a clear trend that should be confirmed by a trendline or a trend channel.
6) If two levels are located too close to each other (from 5 to 15 pips), they should be considered support and resistance levels.
On the chart:
Support and Resistance levels are the levels that serve as targets when buying or selling the pair. You can place Take Profit near these levels.
Red lines are channels or trend lines that display the current trend and show in which direction it is better to trade now.
The MACD indicator (14, 22, and 3) consists of a histogram and a signal line. When they cross, this is a signal to enter the market. It is recommended to use this indicator in combination with trend patterns (channels and trendlines).
Important announcements and economic reports that can be found on the economic calendar can seriously influence the trajectory of a currency pair. Therefore, at the time of their release, we recommend trading as carefully as possible or exiting the market in order to avoid sharp price fluctuations.
Beginners on Forex should remember that not every single trade has to be profitable. The development of a clear strategy and money management is the key to success in trading over a long period of time.