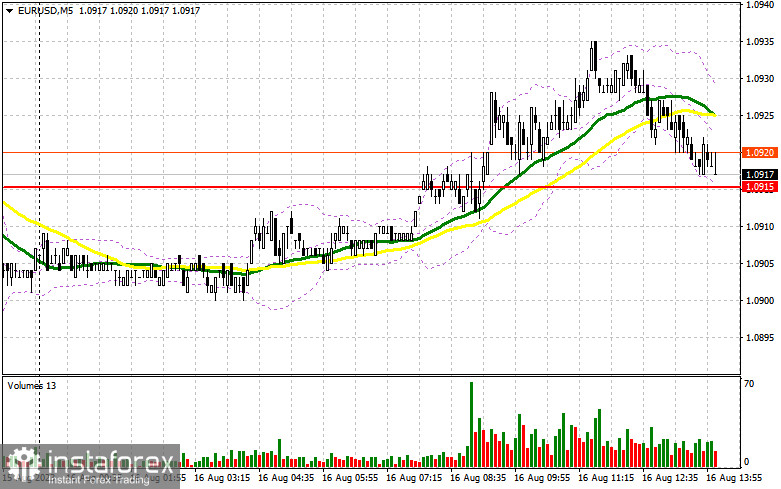
In my morning forecast, I drew attention to the level of 1.0915 and recommended making decisions on entering the market from it. Let's look at the 5-minute chart and figure out what happened there. The breakthrough at 1.0915 occurred without a retest, so it was impossible to get suitable entry points from this level in the first half of the day. For this reason, the technical picture for the American session was revised.
To open long positions on EUR/USD:
In the second half of the day, some important data related to construction in the U.S. are expected, where things could have been better lately. The figures on the volume of issued building permits and the number of new foundations laid could lead to a spike in volatility, and good indicators of growth in industrial production in the U.S. will surely return pressure on the pair. However, the July meeting minutes of the Federal Reserve System will be even more interesting. Even though I do not expect to see anything new in it that the market doesn't already know, a more hawkish stance by some committee members could further strengthen the position of the U.S. dollar.
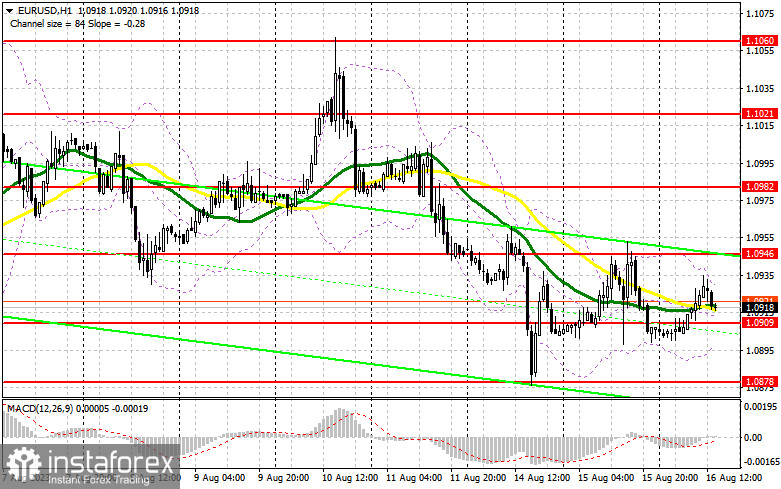
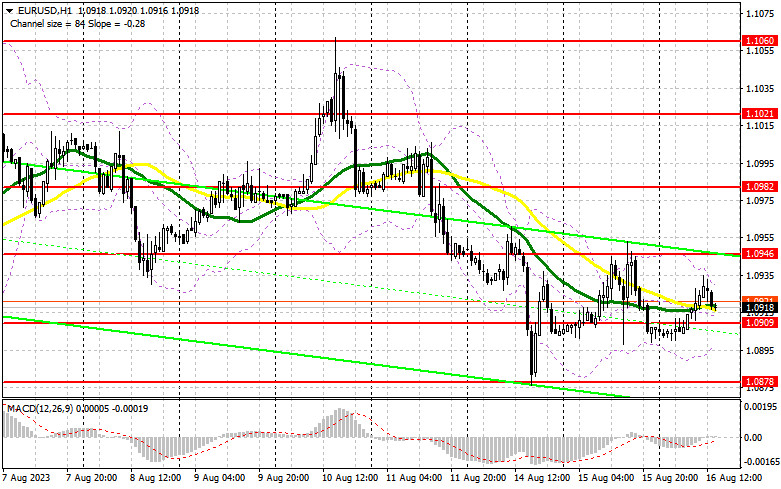
For this reason, I will not rush to buy. It would be best to wait for a decrease in the pair to the new support area of 1.0909, formed during the European session. Forming a false breakout at this level will provide a suitable entry point for buying, continuing the development of the ascending correction to renew resistance at 1.0946. A breakout and top-down test of this range will increase demand for the euro, giving a chance to continue the ascending trend and update the maximum at 1.0982. The furthest target remains the area of 1.1021, where I will fix the profit. In the event of a decrease in EUR/USD and lack of activity at 1.0909 in the second half of the day, which is quite possible after strong data from the U.S., pressure on the pair will return. In this case, only the formation of a false breakout in the area of the next support of 1.0878 - this week's minimum, will give a signal to buy the euro. I will open long positions on the rebound immediately from 1.0836 with the aim of an ascending correction of 30-35 points within the day.
To open short positions on EUR/USD:
Sellers are counting on good figures from the U.S. and a hawkish FOMC protocol that will support the bearish trend and return pressure on the pair. I will act only after growth and the formation of a false breakout in the nearest resistance area at 1.0946, which will lead to a signal for sale and a fall of the pair to support at 1.0908, formed in the first half of the day. Only after a breakthrough and consolidation below this range and a reverse test from the bottom up can a sell signal be obtained, opening a direct path to a minimum of 1.0878. The furthest target will be the area of 1.0836, which will indicate the formation of a bearish trend. There, I will fix the profit. In case of an upward movement of the EUR/USD during the American session and the absence of bears at 1.0946, which cannot be ruled out, bulls will try to re-enter the market – especially with a more dovish FOMC protocol. In such a development, I will postpone short positions to the next resistance at 1.0982. It is also possible to sell there, but only after unsuccessful consolidation. I will open short positions immediately on the rebound from the maximum of 1.1021 with the aim of a downward correction of 30-35 points.
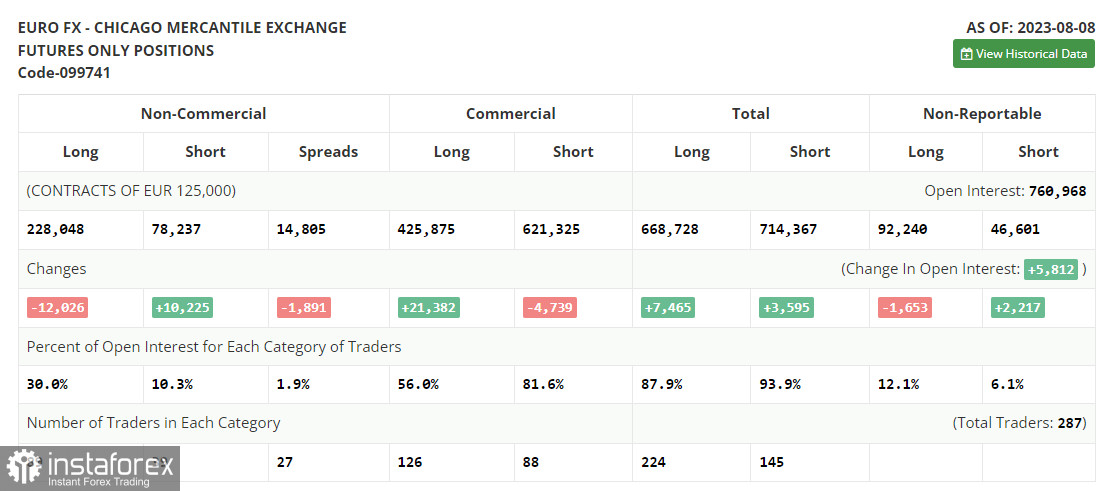
In the COT (Commitment of Traders) report for August 8, there was a decrease in long positions and an increase in short ones. All of this occurred before the release of rather important inflation data in the U.S., which, in theory, should have helped determine the Federal Reserve System's future policy. However, this did not happen, as prices in the U.S. rose again in July of this year, maintaining the prerequisites for further rate hikes by the regulator. However, the fall of the euro is quite an attractive moment, as, despite this, the optimal medium-term strategy in the current conditions remains to buy risk assets on the decline. The COT report states that long non-commercial positions decreased by 12,026 to 228,048, while short non-commercial positions grew by 10,225 to 78,237. As a result, the spread between long and short positions decreased by 1,891. The closing price was 1.0981 compared to 1.0999 a week earlier.
Indicator signals:
Moving Averages:
Trading is conducted around the 30 and 50-day moving averages, indicating market uncertainty.
Note: The author considers the period and prices of the moving averages on the hourly chart H1 and differ from the general definition of classic daily moving averages on the daily chart D1.
Bollinger Bands:
In the case of growth, the upper boundary of the indicator in the area of 1.0935 will act as resistance.
Description of indicators
• Moving average (determines the current trend by smoothing out volatility and noise). Period 50. Marked in yellow on the chart.
• Moving average (determines the current trend by smoothing out volatility and noise). Period 30. Marked in green on the chart.
• MACD indicator (Moving Average Convergence/Divergence – convergence/divergence of moving averages) Fast EMA period 12. Slow EMA period 26. SMA period 9.
• Bollinger Bands. Period 20.
• Non-commercial traders - speculators, such as individual traders, hedge funds, and large institutions that use the futures market for speculative purposes and meet specific requirements.
• Long non-commercial positions represent the total long open position of non-commercial traders.
• Short non-commercial positions represent the total short open position of non-commercial traders.
• The total non-commercial net position is the difference between non-commercial traders' short and long positions.