یہ حصّہ انسٹا فاریکس کے ساتھ تجارت کے بارے میں سب سے اہم معلومات فراہم کرتا ہے۔ ہم تجربہ کار تاجروں کے لیے سرکردہ ماہرین کے تجزیات اور نیاء شروع کرنے والوں کے لیے تجارتی حالات پر مضامین دونوں فراہم کرتے ہیں۔ ہماری خدمات آپ میں نفع صلاحیت کو بڑھانے میں مدد کریں گار ہوںگی
یہ حصّہ اُن لوگوں کے لیے تیار کیا گیا ہے جو ابھی اپنا تجارتی سفر شروع کر رہے ہیں۔ انسٹا فاریکس کا تعلیمی اور تجزیاتی مواد آپ کی تربیتی ضروریات کو پورا کرے گا۔ ہمارے ماہرین کی سفارشات تجارتی کامیابی کے لیے آپ کے ابتدائی اقدامات کو آسان اور واضح بنا دیں گی
انسٹا فاریکس کی جدید خدمات پیداواری سرمایہ کاری کا ایک لازمی عنصر ہیں۔ ہم اپنے صارفین کو جدید تکنیکی صلاحیتیں فراہم کرنے اور ان کے تجارتی معمولات کو سہل بنانے کے لئے کوشاں ہیں کیونکہ ہمیں اس سلسلے میں بہترین بروکر کے طور پر جانا جاتا ہے۔
انسٹا فاریکس کے ساتھ شراکت فائدہ مند اور اعلیٰ درجے کی ہے۔ ہمارے ملحقہ پروگراموں میں شامل ہوں اور بونس، پارٹنر انعامات اور عالمی شہرت یافتہ برانڈ کی ٹیم کے ساتھ سفر کرنے کے امکانات سے لطف اندوز ہوں۔
یہ حصّہ انسٹا فاریکس کی جانب سے سب سے زیادہ منافع بخش پیشکشوں پر مشتمل ہے۔ کسی اکاؤنٹ میں رقم جمع کروانے پر بونس حاصل کریں، دوسرے تاجروں سے مقابلہ کریں، اور ڈیمو اکاؤنٹ میں ٹریڈنگ کرتے وقت بھی حقیقی انعامات حاصل کریں۔
انسٹا فاریکس کے ساتھ تعطیلات نہ صرف خوشگوار بلکہ سود مند بھی ہیں۔ ہم ایک ون اسٹاپ پورٹل، متعدد فورمز، اور کارپوریٹ بلاگز پیش کرتے ہیں، جہاں تاجران تجربات کا تبادلہ کر سکتے ہیں اور فاریکس کمیونٹی میں کامیابی سے شامل ہو سکتے ہیں۔
انسٹا فاریکس ایک بین الاقوامی برانڈ ہے جسے 2007 میں بنایا گیا تھا۔ کمپنی آن لائن ایف ایکس ٹریڈنگ کے لیے خدمات فراہم کرتی ہے اور اسے دنیا کے معروف بروکرز میں سے ایک جانا جاتا ہے۔ ہم نے سے زیادہ ریٹیل تاجران 7,000,000کا اعتماد جیت لیا ہے، جنہوں نے پہلے ہی ہمارے بھروسہ کو سراہا ہے اور اختراعات پر توجہ مرکوز کی ہے۔
GBP/USD Analysis: A Closer Look at Market Movements
Evaluating GBP/USD's Current Position and Potential Directions
Key Takeaways:
The GBP/USD pair shows fluctuating trends with key support and resistance levels.
Both bullish and bearish scenarios are possible, depending on key technical indicators.
Traders should be mindful of market sentiment and pivot points for informed decision-making.
Technical Market Outlook: Understanding the GBP/USD Pair
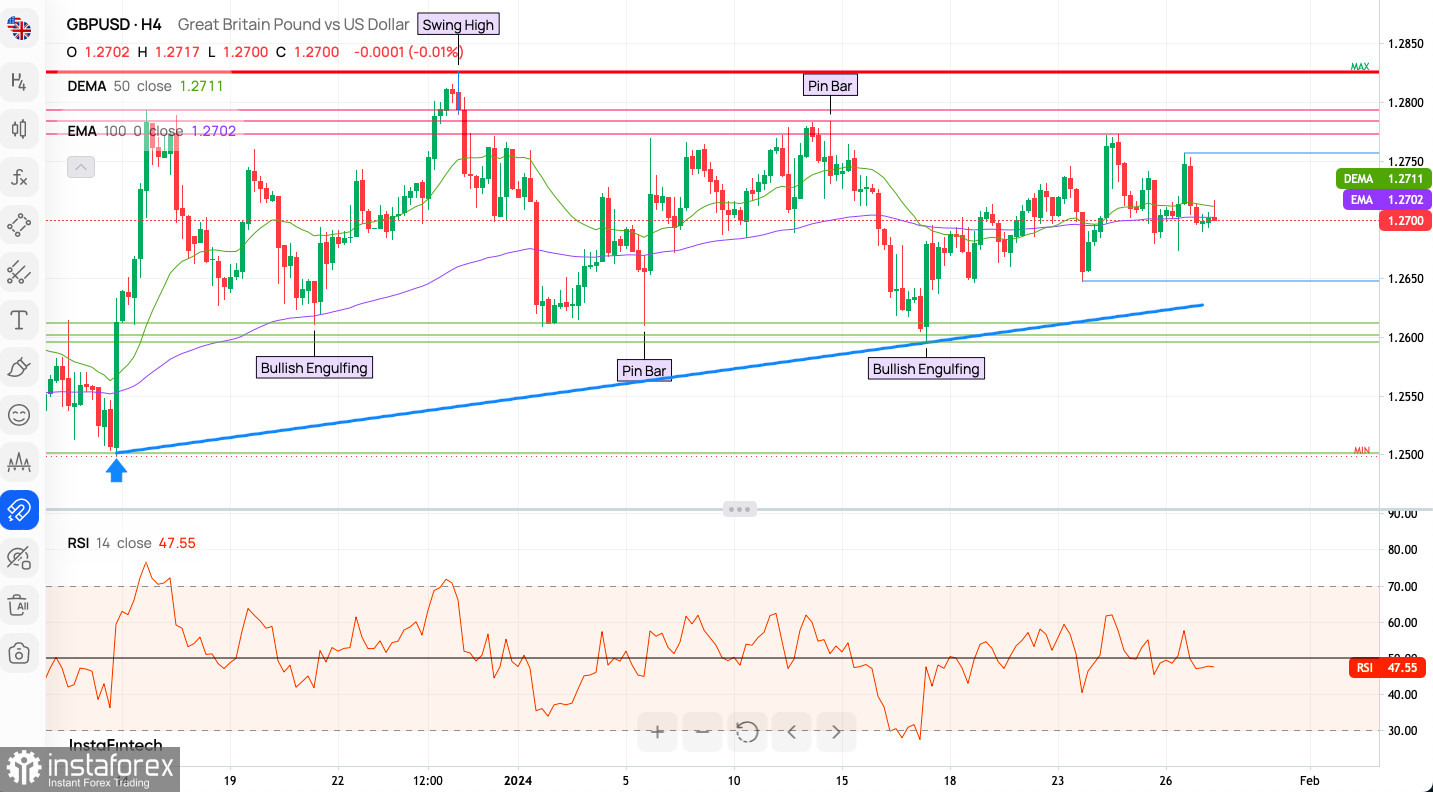
The GBP/USD pair recently experienced a spike, surpassing the 50-period MA (Moving Average) on the H4 time frame and reaching a local high of 1.2757. However, it reversed back to its range, with the next bearish targets at 1.2675 and 1.2648, both serving as intraday technical support levels. Resistance levels are identified at 1.2757 and 1.2773. With the H4 chart momentum around a neutral 50, the short-term market outlook remains uncertain, capable of shifting towards neutrality or bearishness.
Candlestick Patterns:
The H4 time frame chart shows 'Bullish Engulfing' patterns, hinting at possible bullish reversals.
'Pin Bars' indicate potential price rejections, particularly at downtrend bottoms.
Moving Averages:
The 50-period DEMA and 100-period EMA around the current price point to market indecision.
Support and Resistance:
Defined resistance (red) and a rising support trendline (blue) indicate an ascending trend.
Relative Strength Index (RSI):
The RSI at 47.55 is neutral, not strongly favoring either bulls or bears.
Intraday Indicator Signals:
H1 Intraday Analysis:
Out of 21 technical indicators, 6 suggest a Buy, 9 are Neutral, and 8 point to a Sell.
For the 18 moving averages analyzed, 12 indicate a Buy while 6 lean towards a Sell.
Market Sentiment:
The general sentiment is bullish (58% vs. 42% bears).
Last week maintained this bullishness (56% vs. 44% bears), though recent days have seen a bearish shift (48% vs. 52% bears).
Weekly Pivot Points:
WR3 - 1.27609
WR2 - 1.27332
WR1 - 1.27202
Weekly Pivot - 1.27055
WS1 - 1.26925
WS2 - 1.26778
WS3 - 1.26501
Trading Insights: Prospective Scenarios for GBP/USD
Bullish Scenario:
Maintaining the Ascending Trendline: Price resilience at this level could signal an ongoing uptrend.
Surpassing Moving Averages: A strong move above the DEMA and EMA, particularly with increased volume, may indicate bullish momentum.
Breaking Past Resistance: Overcoming resistance levels may lead to further upward movement.
Bearish Scenario:
Descending Below the Trendline: A break below this line might indicate a trend reversal.
Falling Under Moving Averages: A sharp drop below DEMA and EMA suggests bearish control.
RSI Below 40: Declining RSI values could signal strengthening bearish momentum.
Resistance Levels Holding: Failure to breach resistance, followed by lower highs, could forecast a downtrend.
Conclusion:
Traders should carefully monitor these technical indicators and pivot points, aligning their strategies with the prevailing market sentiment. Both bullish and bearish scenarios are plausible, and staying informed is key to adapting to these market changes.
The begginers in forex trading need to be very careful when making decisions about entering the market. Before the release of important reports, it is best to stay out of the market to avoid being caught in sharp market fluctuations due to increased volatility. If you decide to trade during the news release, then always place stop orders to minimize losses.
Without placing stop orders, you can very quickly lose your entire deposit, especially if you do not use money management and trade large volumes. For successful trading, you need to have a clear trading plan and stay focues and disciplined. Spontaneous trading decision based on the current market situation is an inherently losing strategy for a scalper or daytrader.
اپنے اکاؤنٹ میں 3000 ڈالر جمع کروائیں اور حاصل کریں$6000 مزید!
ہم دسمبر قرعہ اندازی کرتے ہیں $6000چانسی ڈیپازٹ نامی مقابلہ کے تحت
اپنے اکاؤنٹ میں 3000 ڈالر جمع کروانے پر موقع حاصل کریں - اس شرط پر پورا اُترتے ہوئے اس مقابلہ میں شرکت کریں