منگل کی تجارت کا تجزیہ:
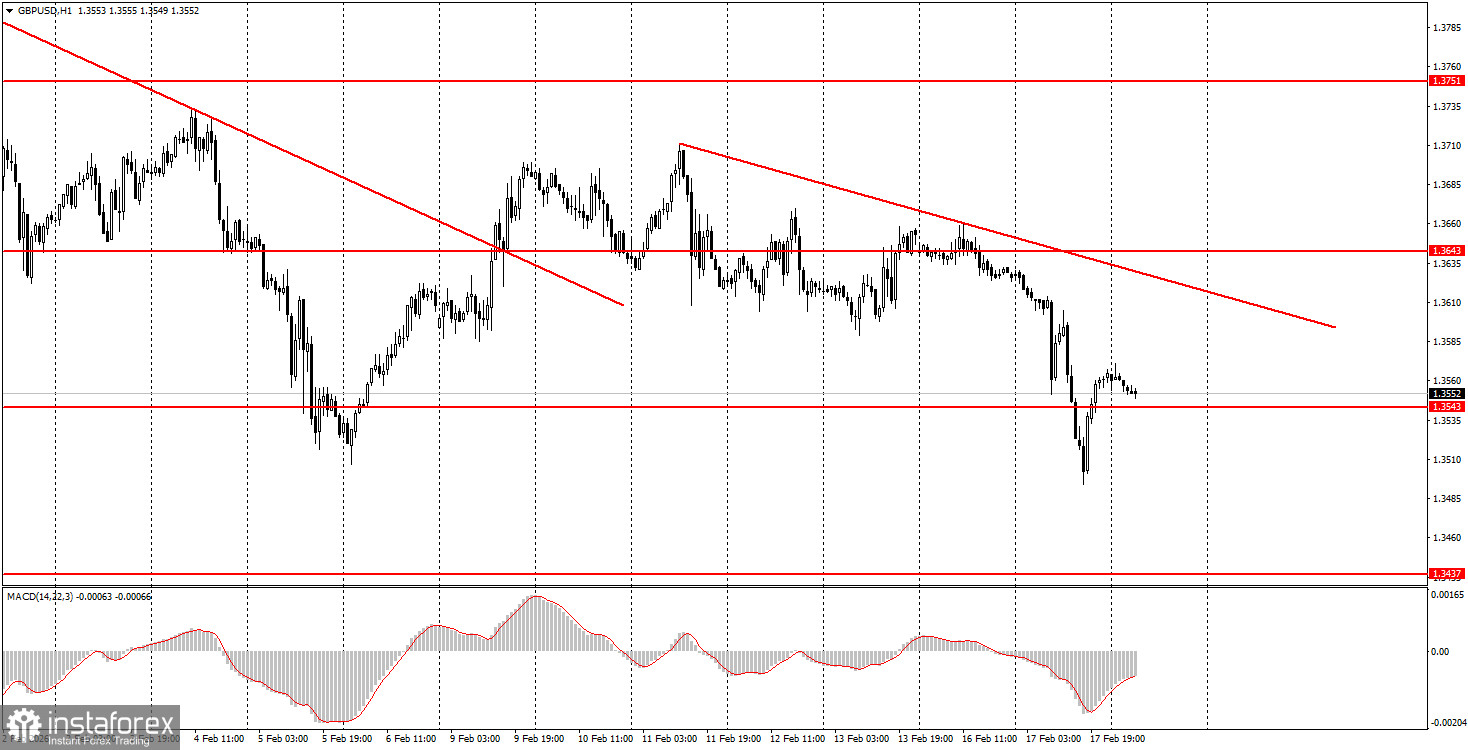
برطانوی پاؤنڈ/امریکی ڈالر کی جوڑی کا 1 گھنٹے کا چارٹ
برطانوی پاؤنڈ/امریکی ڈالر جوڑی نے منگل کو ایک نمایاں کمی کا مظاہرہ کیا، جو واضح طور پر کہا جائے تو اس کا مستحق نہیں تھا۔ اس دن برطانوی پاؤنڈ کے لیے واحد منفی عنصر برطانیہ کی بے روزگاری رپورٹ تھی، جو غیر متوقع طور پر 5.2 فیصد تک پہنچ گئی۔ اس منفی پیشرفت کی وجہ سے دن میں 130 پِپ کی کمی واقع ہوئی، اور پونڈ صرف شام کو تھوڑا سا ٹھیک ہوا۔ دوسری برطانوی رپورٹوں کی تاجروں کے لیے کوئی اہمیت نہیں تھی، اور برطانوی پاؤنڈ پورے ایک ہفتے سے گرا ہوا ہے، اکثر کوئی خاطر خواہ بنیادوں کے بغیر۔ آج، پاؤنڈ کو طاقت کے ایک اور امتحان کا سامنا کرنا پڑے گا۔ چند گھنٹوں میں برطانیہ کی افراط زر کی رپورٹ شائع کر دی جائے گی۔ اگر یہ انڈیکیٹر جنوری میں نمایاں طور پر سست نکلتا ہے، تو بینک آف انگلینڈ کی طرف سے اگلی میٹنگ میں شرح میں کمی کا امکان مؤثر طور پر 100% کے برابر ہو جائے گا۔ ایک ہی وقت میں، یہ عنصر پہلے ہی ایک پورے ہفتے کے لیے پاؤنڈ کی گراوٹ کا سبب بن چکا ہے۔ لہذا، ہمیں زوال کے بجائے عروج کو دیکھ کر حیرانی نہیں ہوگی۔
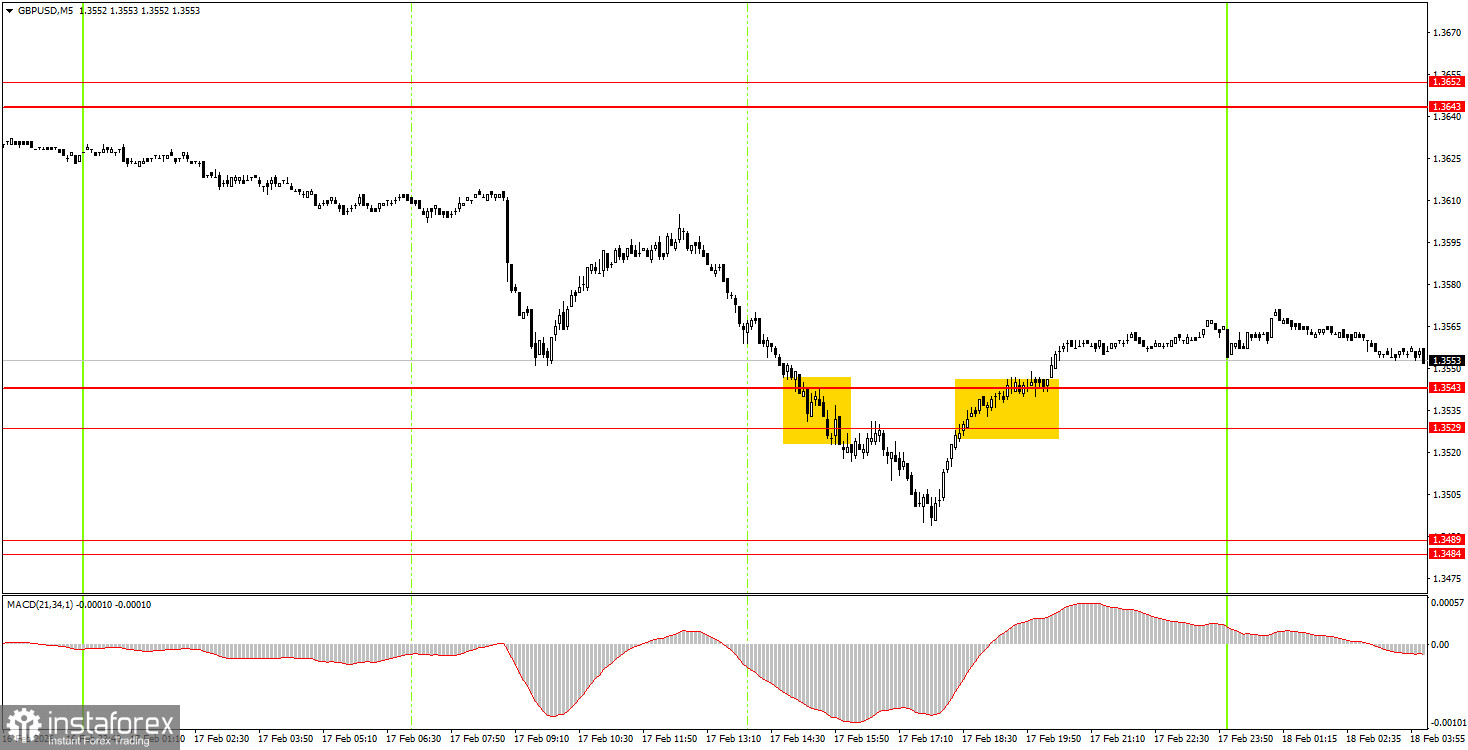
برطانوی پاؤنڈ/امریکی ڈالر کی جوڑی کا 5 منٹ کا چارٹ
5 منٹ کے ٹائم فریم پر، منگل کو دو تجارتی سگنل بنائے گئے، لیکن پیر کو، قیمت نے پہلے ہی 1.3643-1.3652 کے علاقے میں سیل سگنل بنا دیا تھا، جسے ہم نے اگلے دن تک لے جانے کا مشورہ دیا۔ اس سگنل نے ابتدائی تاجروں کو اچھا منافع کمانے کی اجازت دی۔ دن کے دوران، قیمت پہلے ایک سمت میں 1.3529-1.3543 رینج سے گزری، پھر دوسری سمت۔ آخری خرید سگنل پر بھی عمل کیا جا سکتا تھا اور اگلے دن تک لے جایا جا سکتا تھا۔
بدھ کو تجارت کیسے کی جائے۔:
فی گھنٹہ ٹائم فریم پر،برطانوی پاؤنڈ/امریکی ڈالر کے جوڑے نے نیچے کی طرف رجحان کو توڑ دیا ہے اور... ایک نیا تشکیل دیا ہے۔ درمیانی مدت کے ڈالر کی نمو کے لیے کوئی عالمی بنیاد نہیں ہے، اس لیے ہم 2025 سے عالمی سطح پر اوپر کی جانب رجحان جاری رہنے کی توقع رکھتے ہیں، جو جوڑی کو 1.4000 کے نشان تک لے جا سکتا ہے۔ حالیہ ہفتوں میں، حالات اکثر برطانوی کرنسی کے حق میں نہیں رہے، اور جنوری کے وسط میں کئی فعال ہفتوں کے بعد، مارکیٹ ایک بار پھر جمود کی حالت میں آ گئی۔
بدھ کو، ابتدائی تاجر طویل پوزیشنوں پر رہ سکتے ہیں، کیونکہ جوڑی 1.3529-1.3543 کے علاقے سے گزر چکی ہے، جس کا ہدف 1.3643-1.3652 ہے۔ 1.3529-1.3543 کے رقبے سے نیچے کا استحکام 1.3484-1.3489 کے ہدف کے ساتھ شارٹس کھولنے کی اجازت دے گا۔
5 منٹ کے ٹائم فریم پر، تجارت کے لیے لیولز میں 1.3319-1.3331، 1.3365، 1.3403-1.3407، 1.3437-1.3446، 1.3484-1.3489، 1.3529-1.3534، 1.3529-1.353. 1.3741-1.3751، 1.3814-1.3832، 1.3891-1.3912، اور 1.3975۔
بدھ کو، یوکے میں جنوری کی افراط زر پر ایک رپورٹ شائع ہونے والی ہے، جو اس دن کی ایک اہم تقریب ہے۔ امریکہ میں، صرف چند ثانوی رپورٹس ہیں، جو کہ، تاہم، ردعمل کو بھڑکا سکتی ہیں۔
تجارتی نظام کے اہم اصول:
سگنل کی طاقت کا تعین اس وقت سے ہوتا ہے جب اسے بننے میں لگتا ہے (لیول کو ریباؤنڈ کرنا یا ٹوٹنا)۔ وقت جتنا کم ہوگا، سگنل اتنا ہی مضبوط ہوگا۔
اگر غلط سگنلز کی بنیاد پر کسی خاص سطح کے ارد گرد دو یا زیادہ تجارتیں کھولی گئی ہیں، تو اس سطح سے آنے والے تمام سگنلز کو نظر انداز کر دینا چاہیے۔
ایک فلیٹ مارکیٹ میں، کوئی بھی جوڑا متعدد غلط سگنل پیدا کر سکتا ہے یا کوئی سگنل نہیں ہے۔ کسی بھی صورت میں، فلیٹ کی پہلی علامات پر تجارت کو روکنا بہتر ہے۔
تجارت یورپی سیشن کے آغاز کے درمیان اور امریکی سیشن کے وسط تک کے دوران کھولی جاتی ہے، جس کے بعد تمام تجارت کو دستی طور پر بند کر دیا جانا چاہیے۔
فی گھنٹہ ٹائم فریم پر، MACD اشارے سے سگنلز کی تجارت صرف اس صورت میں کی جانی چاہیے جب اچھا اتار چڑھاؤ ہو اور ٹرینڈ لائن یا چینل سے اس کی تصدیق ہو۔
اگر دو سطحیں ایک دوسرے کے بہت قریب ہیں (5 سے 20 پپس تک)، تو انہیں ایک سپورٹ یا مزاحمتی علاقہ سمجھا جانا چاہیے۔
15-20 پِپس کو درست سمت میں منتقل کرنے کے بعد، سٹاپ لاس کو بریک ایون پر سیٹ کرنے کا مشورہ دیا جاتا ہے۔
چارٹس پر کیا ہے۔:
سپورٹ اور مزاحمتی سطحیں خرید و فروخت کے کاروبار کو کھولنے کے اہداف ہیں۔ ٹیک پرافٹ لیولز ان کے آس پاس رکھی جا سکتی ہیں۔
سرخ لکیریں ایسے چینلز یا ٹرینڈ لائنز کی نشاندہی کرتی ہیں جو موجودہ رجحان کی عکاسی کرتی ہیں اور اب ٹریڈنگ کے لیے ترجیحی سمت کی نشاندہی کرتی ہیں۔
MACD اشارے (14,22,3) - ہسٹوگرام اور سگنل لائن - ایک اضافی اشارے کے طور پر کام کرتا ہے جسے سگنلز کے ذریعہ کے طور پر بھی استعمال کیا جا سکتا ہے۔
اہم تقاریر اور رپورٹس (ہمیشہ نیوز کیلنڈر میں پائی جاتی ہیں) کرنسی کے جوڑے کی نقل و حرکت کو نمایاں طور پر متاثر کر سکتی ہیں۔ لہذا، ان کے اجراء کے دوران، ٹریڈنگ زیادہ سے زیادہ احتیاط کے ساتھ کی جانی چاہیے، یا اسے مارکیٹ سے باہر نکلنے کا مشورہ دیا جاتا ہے تاکہ سابقہ حرکت کے مقابلے میں قیمتوں میں تیزی سے تبدیلی سے بچا جا سکے۔
فاریکس مارکیٹ میں تجارت کرنے والوں کو یاد رکھنا چاہیے کہ ہر تجارت منافع بخش نہیں ہو سکتی۔ ایک واضح حکمت عملی تیار کرنا اور پیسے کے صحیح انتظام پر عمل کرنا طویل مدتی تجارتی کامیابی کی کلید ہیں۔