Analysis of Tuesday's Trades:
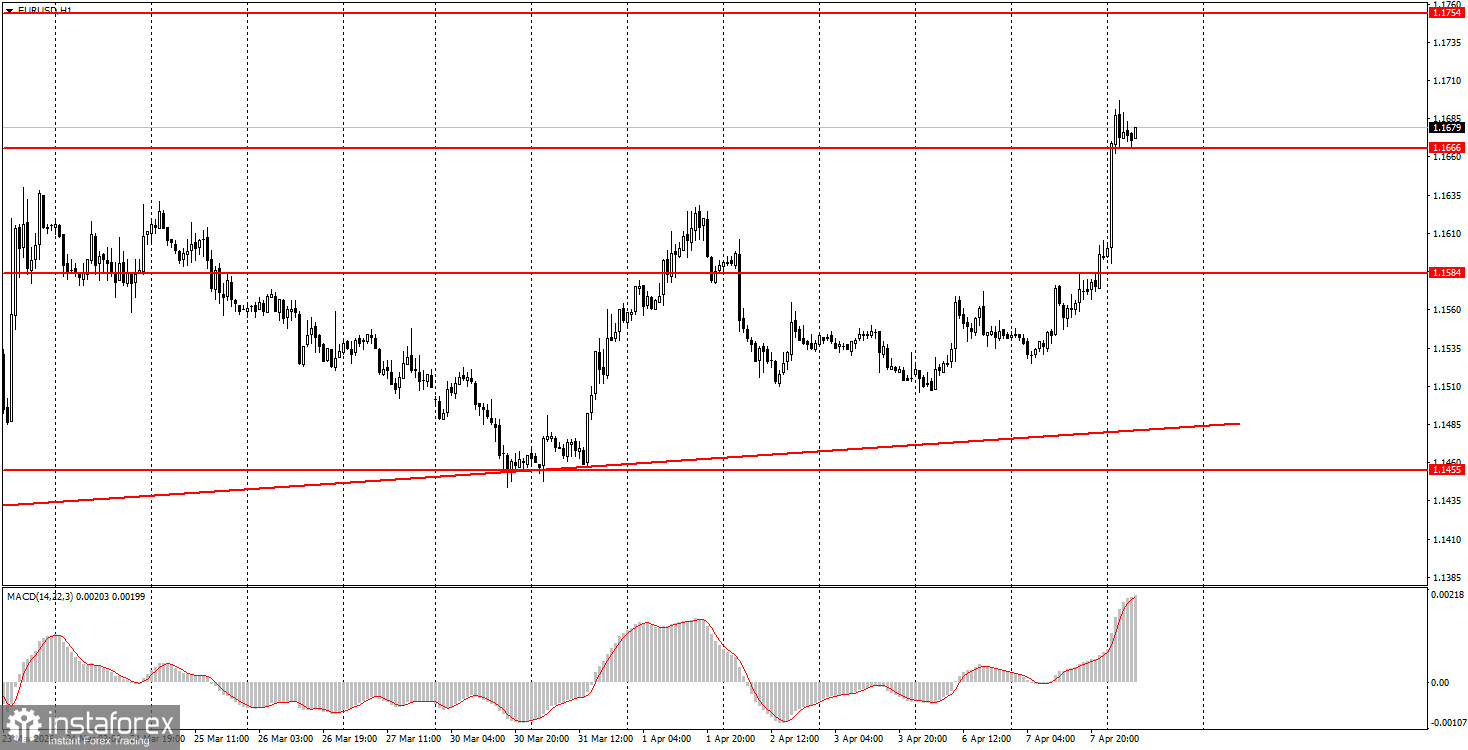
1H Chart of the EUR/USD Pair
The EUR/USD currency pair traded relatively calmly on Tuesday, ignoring any macroeconomic events. By the evening, the geopolitical situation had heated to the limit, and reports began to emerge from the U.S. about a potential nuclear strike on Iran. However, the worst fears did not materialize. Initially, Donald Trump announced that Iran had agreed to open the Strait of Hormuz for two weeks, and then Iranian officials stated that Washington had accepted all conditions and even declared a complete victory in the war. Regardless, the conflict is on pause for another two weeks, and missile strikes are halted for this period. Oil and gas prices immediately plummeted, as did the American currency, which was no longer needed by traders as a safe-haven asset. Everything is logical and predictable; it's just unfortunate that such a development was impossible to foresee. However, the conflict cannot yet be considered over, but the markets have received a two-week pause.
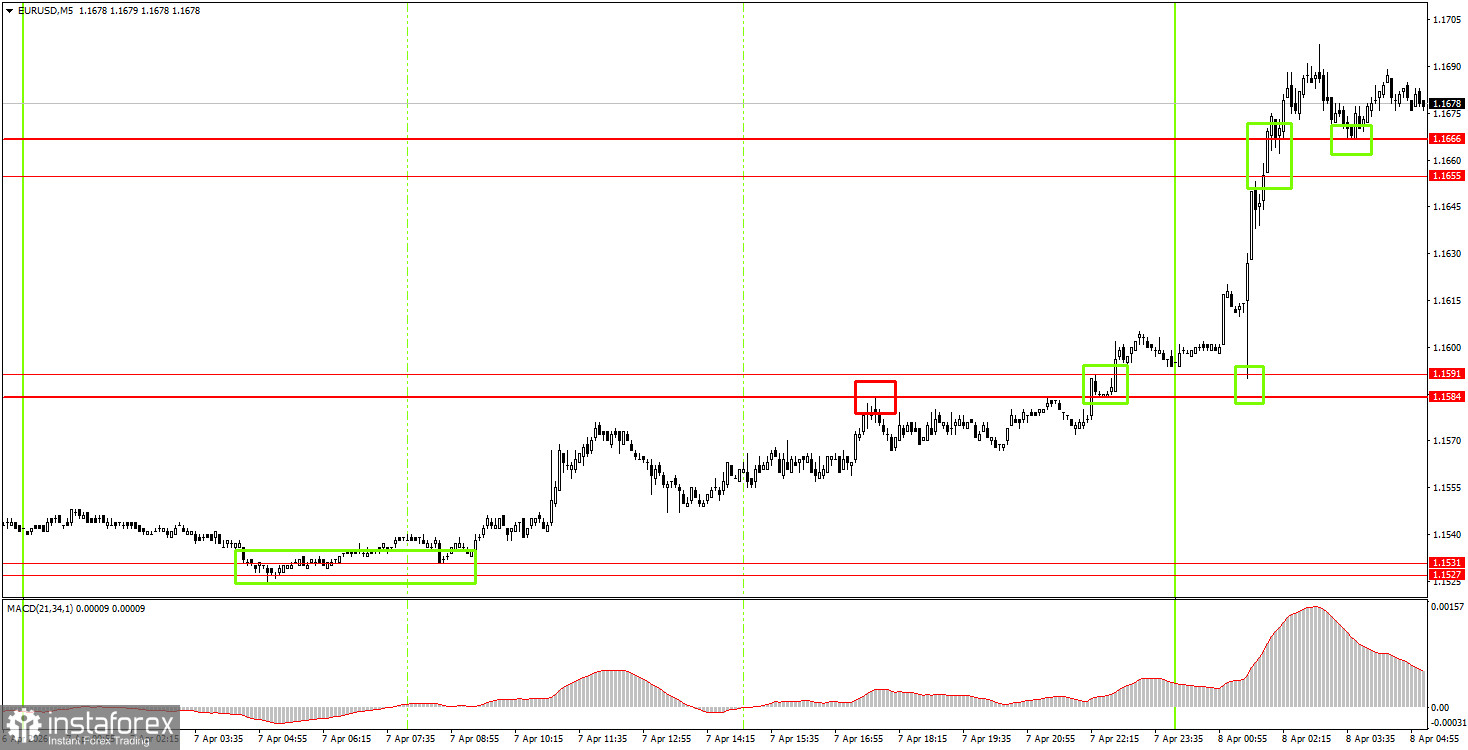
5M Chart of the EUR/USD Pair
On the 5-minute time frame, two trading signals were formed on Tuesday, but the most interesting movements occurred on Wednesday. It was on Wednesday during the Asian session that the EUR/USD pair skyrocketed on the de-escalation of the war in the Middle East and the opening of the Strait of Hormuz. Beginner traders can execute the first buy signal painlessly around the area of 1.1527-1.1531.
How to Trade on Wednesday:
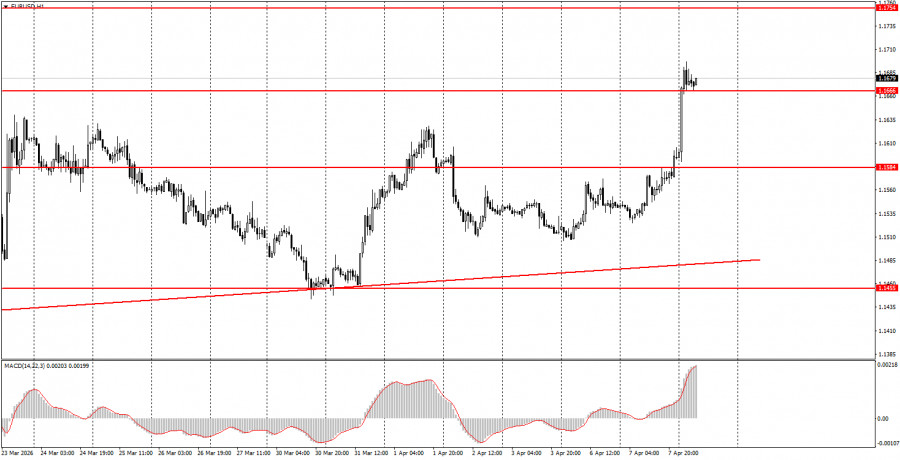
On the hourly time frame, the upward trend has once again changed due to geopolitics, and further movements of the pair will depend on the same geopolitical factors. The market continues to trade exclusively on geopolitics and emotions. Therefore, "rollercoaster" movements may continue for a long time, and macroeconomic, technical, and fundamental factors are not significant. Trump alone continually provokes both declines and surges in the U.S. dollar.
On Wednesday, beginner traders may consider short positions if the price consolidates below the 1.1655-1.1666 area, targeting 1.1584-1.1591. A price bounce from the area of 1.1655-1.1666 will allow for long positions to be opened with targets at 1.1745-1.1754.
On the 5-minute time frame, levels to watch include 1.1267-1.1292, 1.1354-1.1363, 1.1413, 1.1455-1.1474, 1.1527-1.1531, 1.1584-1.1591, 1.1655-1.1666, 1.1745-1.1754, 1.1830-1.1837, 1.1899-1.1908. On Wednesday, the minutes from the last Federal Reserve meeting will be published in the U.S., unlikely to interest anyone, while in the Eurozone, a retail sales report will be released. We believe that today, the markets will be in a state of euphoria and continue to react to the temporary truce between Iran and the U.S.
Key Principles of the Trading System:
- The strength of the signal is determined by the time it took to form the signal (bounce or level breakthrough). The shorter the time, the stronger the signal.
- If two or more trades were opened around any level based on false signals, all subsequent signals from that level should be ignored.
- In a range, any pair can generate a lot of false signals or may not generate them at all. Technical levels may be ignored.
- On the hourly timeframe, it is advisable to trade MACD signals only when volatility is good, and the trend is confirmed by a trendline or trend channel.
- If two levels are located too close together (5-20 pips apart), they should be considered a support or resistance area.
- After moving 15 pips in the correct direction, a Stop Loss should be set to breakeven.
What to Look for on the Charts:
Price levels of support and resistance are levels that serve as targets when opening buys or sells. Take Profit levels can be placed around them.
Red lines represent channels or trend lines that show the current trend and indicate the direction in which it is preferable to trade now.
The MACD indicator (14,22,3) – the histogram and the signal line – is a supporting indicator that can also be used as a source of signals.
Important speeches and reports (always included in the news calendar) can significantly affect the movement of the currency pair. Therefore, during their release, trading should be done with utmost caution, or traders should exit the market to avoid sharp price reversals against the previous movement.
Beginning traders in the forex market should remember that not every trade can be profitable. Developing a clear strategy and effective money management are the keys to long-term trading success.