یورو/امریکی ڈالر کا 5 منٹ کا تجزیہ
یورو/امریکی ڈالر کرنسی کے جوڑے نے پیر کو انتہائی سست حرکت کا مظاہرہ کیا، نسبتاً اہم جغرافیائی سیاسی پس منظر کے باوجود جو، مثال کے طور پر، پاؤنڈ کے لیے تقریباً 100 پپس کے اتار چڑھاؤ کا باعث بنا۔ تاہم، یورو نے تجارت کی بہت کم خواہش ظاہر کی۔ ہفتے کے آخر میں ایران اور امریکہ کے درمیان جنگ بندی کی نئی خلاف ورزی کے پس منظر میں ڈالر کی قیمت میں اضافے کے ساتھ دن کا آغاز ہوا، دونوں فریقین نے تنازعہ کو حل کرنے کی تجاویز سے انکار کر دیا۔ اس کے باوجود، ایک بار پھر، واشنگٹن اور تہران نے اپنے مذاکرات ختم نہیں کیے اور کہا کہ وہ بات چیت جاری رکھیں گے۔ اس طرح ڈالر کی قیمت بڑھنے کے ساتھ ساتھ واپس بھی گر گئی۔ دن بھر کوئی اور خبریں یا اپ ڈیٹس نہیں تھے۔
فی گھنٹہ ٹائم فریم پر، اوپر کی طرف رجحان برقرار رہتا ہے، لیکن قیمت نے مسلسل کئی دنوں سے 1.1790 کی سطح سے اوپر کے اضافے کو برقرار رکھنے کے لیے جدوجہد کی ہے۔ تاہم، یورو اس سطح کے خلاف دباؤ ڈال رہا ہے، تجویز کرتا ہے کہ اس ہفتے اوپر کی حرکت جاری رہے گی۔ بلاشبہ، جغرافیائی سیاسی عوامل یورو کے اضافے میں رکاوٹ بن سکتے ہیں، کیونکہ امریکہ اور ایران کے درمیان کچھ بھی ہو سکتا ہے۔ تعطل پر مذاکرات کے ساتھ، ایک نیا اضافہ یا جنگ بندی کی خلاف ورزی ڈالر کو عارضی طور پر بلند کر سکتی ہے۔
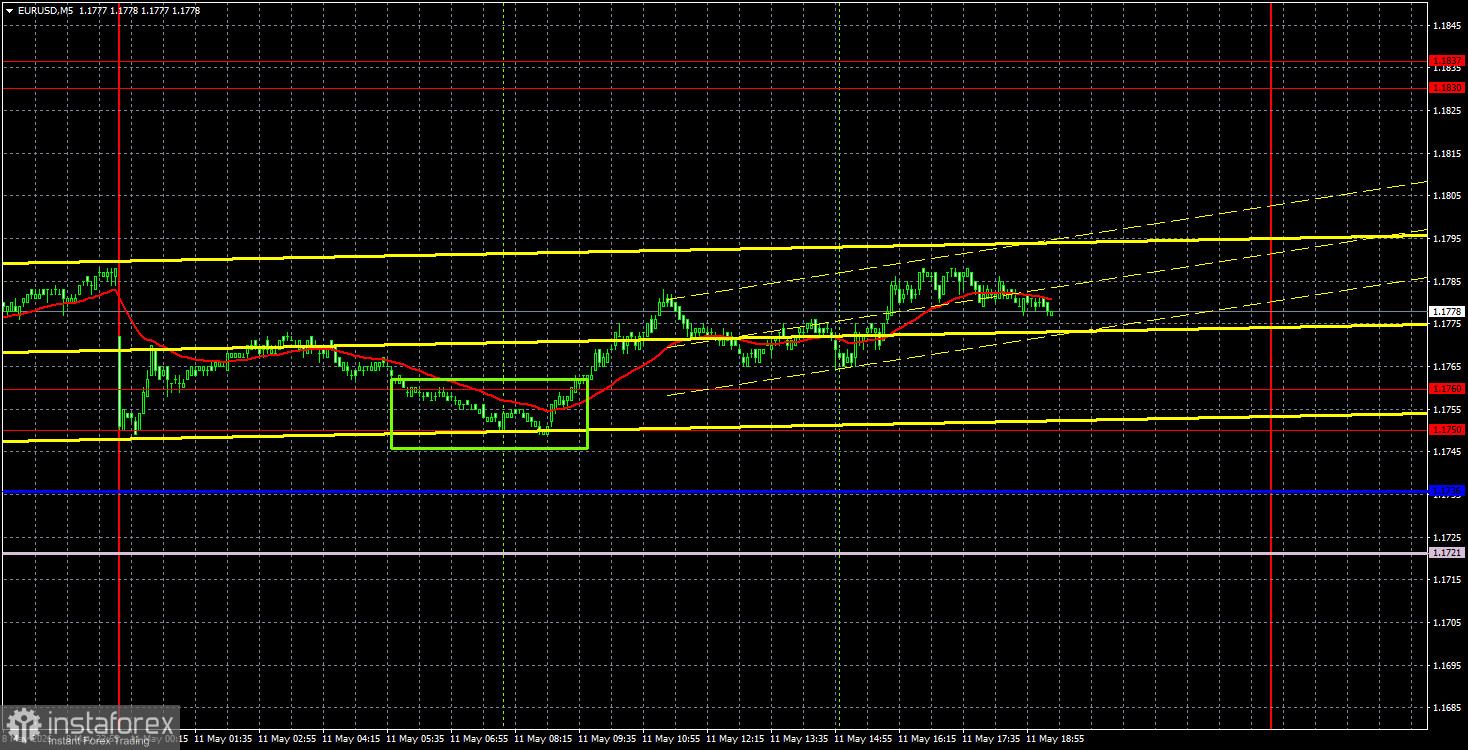
5 منٹ کے ٹائم فریم پر، پیر کو صرف ایک تجارتی سگنل تشکیل دیا گیا تھا۔ یورپی تجارتی سیشن کے دوران، جوڑی نے 1.1750-1.1760 کے علاقے کو اچھال دیا، جس سے تاجروں کو لمبی پوزیشنیں کھولنے کا موقع ملا۔ دن کے اختتام تک، یہ تقریباً 15-20 پِپس کے منافع کے لیے دستی طور پر بند کیے جا سکتے تھے، یا منگل تک لے جا سکتے تھے۔
یورو/امریکی ڈالر کا 4 گھنٹے کا تجزیہ
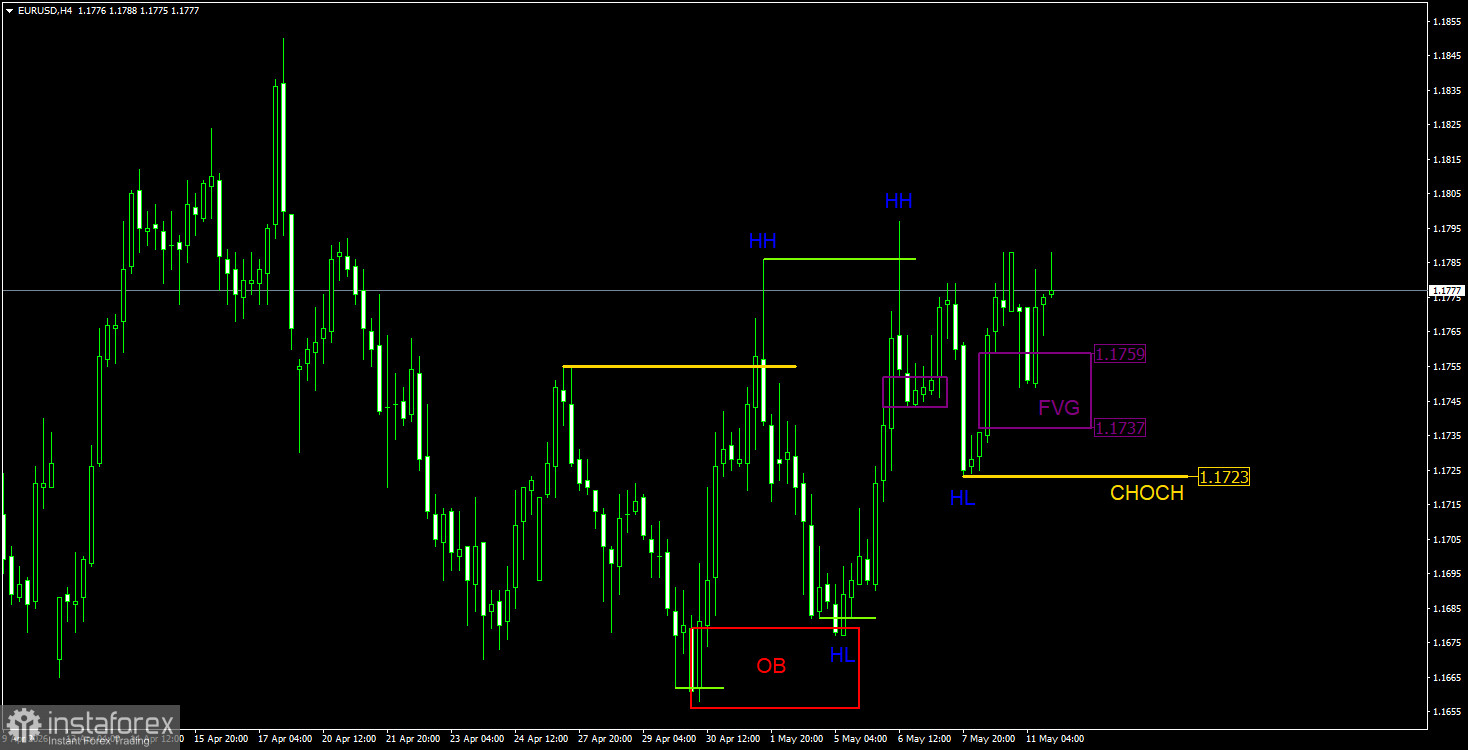
4 گھنٹے کے ٹائم فریم پر، ICT ٹریڈنگ سسٹم کے مطابق صورتحال بھی بالکل واضح ہے۔ 1.1723 پر CHOCH لائن کے ساتھ، اوپر کی طرف رجحان ہے؛ صرف اس سطح سے نیچے ہم اوپر کی رفتار کو ختم ہونے پر غور کر سکتے ہیں۔ جب تک اوپر کی طرف رجحان برقرار رہے گا، ہم صرف تیزی کے نمونوں، سگنلز، اور لیکویڈیٹی گراب پر توجہ مرکوز کریں گے۔ آخری جائزے میں، ہم نے 1.1737-1.1759 کے علاقے میں تیزی سے FVG کو نوٹ کیا۔ اس علاقے کو واقعی پیر کی رات خطاب کیا گیا تھا۔ قیمت نے شناخت شدہ پیٹرن پر رد عمل ظاہر کیا، ایک خرید سگنل تشکیل دیا جس پر تاجر عمل کر سکتے تھے۔ بدقسمتی سے، ہفتے کے پہلے تجارتی دن پر اتار چڑھاؤ پھر کمزور تھا، لیکن تجارت اب بھی تھوڑی دیر کے لیے روکی جا سکتی ہے۔ پیر کو کوئی نیا نمونہ تشکیل نہیں دیا گیا، اور کوئی لیکویڈیٹی گریب نہیں ہوئی۔ FVG پیٹرن پر اب بھی ایک بار پھر توجہ دی جا سکتی ہے۔
یورو/امریکی ڈالر کا 1 گھنٹے کا تجزیہ
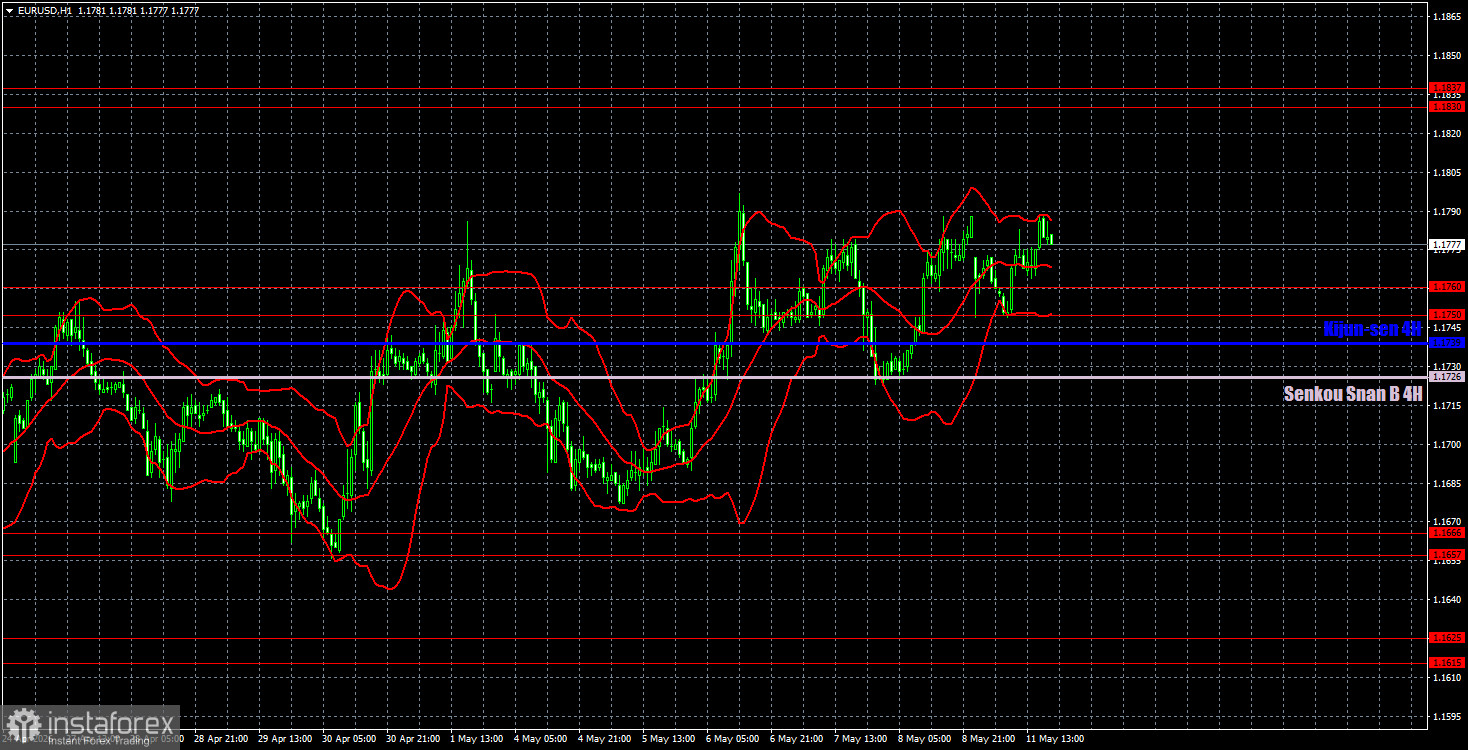
فی گھنٹہ ٹائم فریم پر، یورو/امریکی ڈالر کا جوڑا اپنی چڑھائی جاری رکھتا ہے۔ مشرق وسطیٰ میں حالات بدستور کشیدہ ہیں لیکن خراب نہیں ہو رہے، اس لیے امریکی ڈالر کے مزید مضبوط ہونے کی کوئی وجہ نہیں ہے۔ ڈالر کے پاس جمعہ کو نمو دکھانے کا ہر موقع تھا، لیکن ایک بار پھر، مارکیٹ نے اہم میکرو اکنامک رپورٹس کو نظر انداز کر دیا۔ صرف جغرافیائی سیاسی عوامل مزید ترقی کی راہ میں رکاوٹ بن سکتے ہیں۔
12 مئی کے لیے، ہم مندرجہ ذیل تجارتی سطحوں کو نمایاں کرتے ہیں: 1.1362، 1.1426، 1.1542، 1.1615-1.1625، 1.1657-1.1666، 1.1750-1.1760، 1.1830-1.1919، 1.1830، 1.219، 1.1830۔ جیسا کہ سینکو اسپین بی لائن (1.1726) اور کیجن سین لائن (1.1739)۔ Ichimoku اشارے کی لکیریں دن کے وقت حرکت کر سکتی ہیں، جنہیں تجارتی سگنلز کا تعین کرتے وقت دھیان میں رکھنا چاہیے۔ اگر قیمت 15 پِپس درست سمت میں منتقل ہو جائے تب بھی ٹوٹنے کے لیے سٹاپ لاس آرڈر سیٹ کرنا یاد رکھیں۔ اگر سگنل غلط نکلے تو یہ ممکنہ نقصانات سے بچائے گا۔
منگل کو، EU اور جرمنی میں Economic Sentiment Indexes (ZEW) شائع کیے جائیں گے، اور US اپریل کی افراط زر کی ایک اہم رپورٹ جاری کرے گا۔ ہم یہ کہنا چاہیں گے کہ ہمیں صارفین کی قیمتوں کے اشاریہ پر مارکیٹ کے مضبوط ردعمل کی توقع کرنی چاہیے، لیکن ذرا یاد کریں کہ جمعہ کو لیبر مارکیٹ اور بے روزگاری کے اعداد و شمار پر مارکیٹ نے کیا ردعمل ظاہر کیا...
تجارتی تجاویز:
آج، تاجر شارٹ پوزیشنز کھول سکتے ہیں اگر قیمت Senkou Span B لائن سے نیچے مضبوط ہو جائے، 1.1657-1.1666 ایریا کو نشانہ بنایا جائے۔ 1.1830-1.1837 کو ہدف بناتے ہوئے 1.1750-1.1760 ایریا میں استحکام اور اچھال کے بعد لمبی پوزیشنیں رکھی جا سکتی ہیں۔ 1.1737-1.1759 کے علاقے میں خرید سگنل بننے کے بعد لانگس کو بھی برقرار رکھا جا سکتا ہے۔
تصاویر کی وضاحت:
سپورٹ اور ریزسٹنس لیولز - موٹی سرخ لکیریں جن پر مارکیٹ کی حرکت ختم ہو سکتی ہے۔ یہ تجارتی سگنل کے ذرائع نہیں ہیں۔
Kijun-sen اور Senkou Span B لائنز - Ichimoku اشارے سے لائنیں 4 گھنٹے کے ٹائم فریم سے گھنٹہ وار ٹائم فریم میں منتقل ہوئیں۔ یہ مضبوط لکیریں سمجھی جاتی ہیں۔
ایکسٹریم لیولز - پتلی سرخ لکیریں جہاں سے قیمت پہلے اچھال چکی ہے۔ یہ تجارتی سگنل کے ذرائع ہیں۔
پیلی لکیریں - ٹرینڈ لائنز، ٹرینڈنگ چینلز، اور کوئی اور تکنیکی پیٹرن۔
CHOCH - رجحان کی ساخت میں تبدیلی۔
لیکویڈیٹی - لیکویڈیٹی، سٹاپ لاس، اور زیر التواء آرڈرز جنہیں مارکیٹ بنانے والے اپنی پوزیشن بنانے کے لیے استعمال کرتے ہیں۔
FVG - فیئر ویلیو گیپ۔ قیمت تیزی سے ایسے علاقوں سے گزرتی ہے، جو مارکیٹ میں ایک فریق کی مکمل عدم موجودگی کی نشاندہی کرتی ہے۔ اس کے بعد، قیمت واپس آتی ہے اور مرکزی رجحان کے ساتھ سیدھ میں ان علاقوں پر ردعمل ظاہر کرتی ہے۔
IFVG - الٹا فیئر ویلیو گیپ۔ ایسے علاقے میں واپس آنے کے بعد، قیمت اس سے رد عمل ظاہر نہیں کرتی ہے۔ اس کے بجائے، یہ زبردستی سے ٹوٹ جاتا ہے اور پھر دوسری طرف سے اس کی جانچ کرتا ہے۔
OB - آرڈر بلاک۔ موم بتی جس پر مارکیٹ بنانے والے نے ایک پوزیشن کھولی جس کا مقصد لیکویڈیٹی کو حاصل کرنا ہے تاکہ وہ مخالف سمت میں اپنی پوزیشن تشکیل دے سکے۔