GBP/USD 5M Analysis
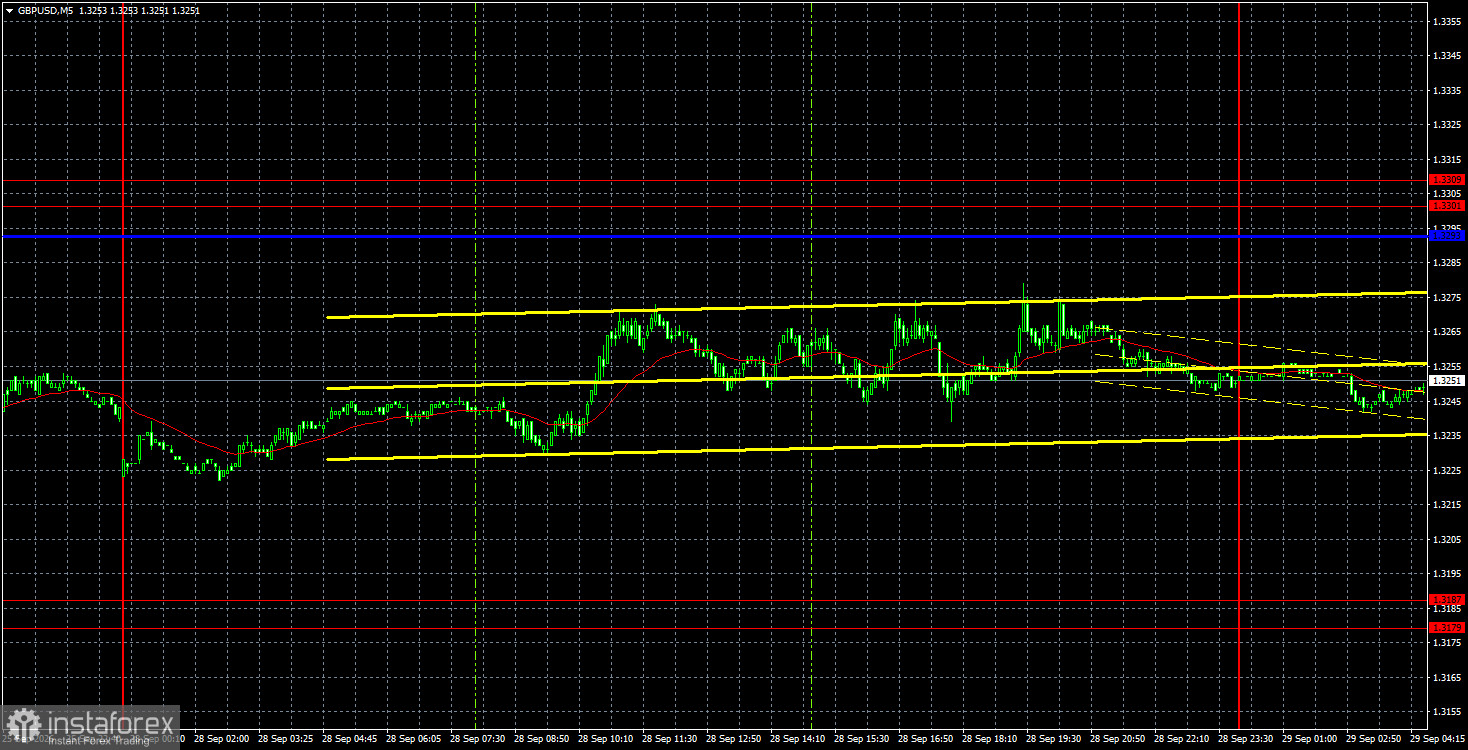
The GBP/USD pair continued its upside correction on Monday, which began on Friday and surprised many. Recall that over the past month the pound, like the euro, has mostly fallen while the dollar has risen. Thus, any rise in the pound or euro now comes as a surprise — sarcasm aside, the pound had no sufficiently strong reasons to collapse over the past month. Note that on the weekly timeframe, GBP/USD has been rangebound for a year. Within a range, most moves are essentially random. A similar picture exists for EUR/USD. Therefore, we believe the dollar's sharp rise is driven less by Federal Reserve policy and more by random moves within the range. The Fed may raise the key rate twice, and the Bank of England is preparing for two tightenings as well. So dollar strength around the Fed meeting is logical; two weeks after the meeting it is not. Nevertheless, the downtrend persists, so in the short term, a further decline in the pair remains likely.
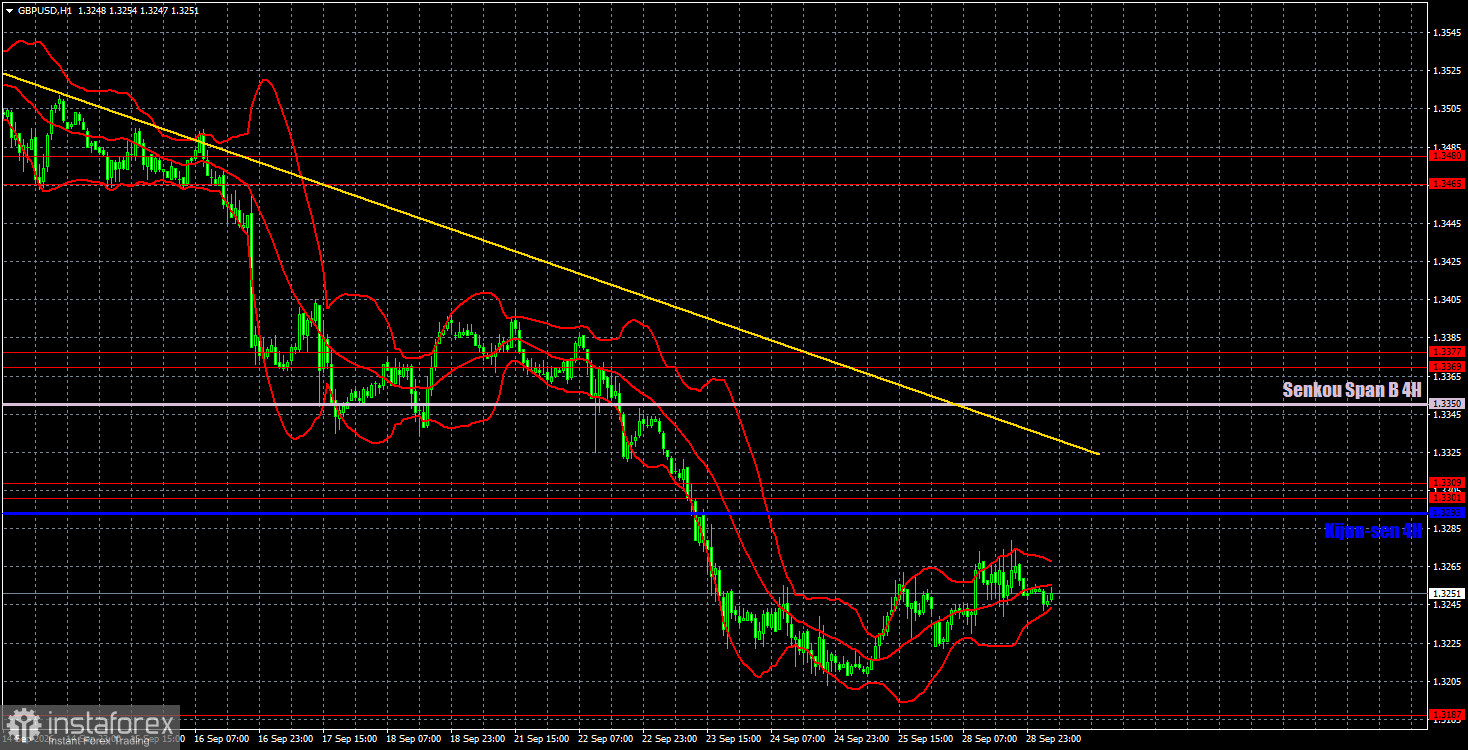
Technically, the pound continues to form a downward trend, as shown by the trend line and price trading below the Ichimoku indicator lines. Under current circumstances, sterling can expect, at best, a correction within the downtrend. Despite the absence of local bearish catalysts, market participants show no willingness to buy the pound now.
On the 5-minute timeframe on Monday, no trading signals were formed. Price did not approach any critical line or zone during the day. As a result, traders had no clear reason to enter the market.
COT Report
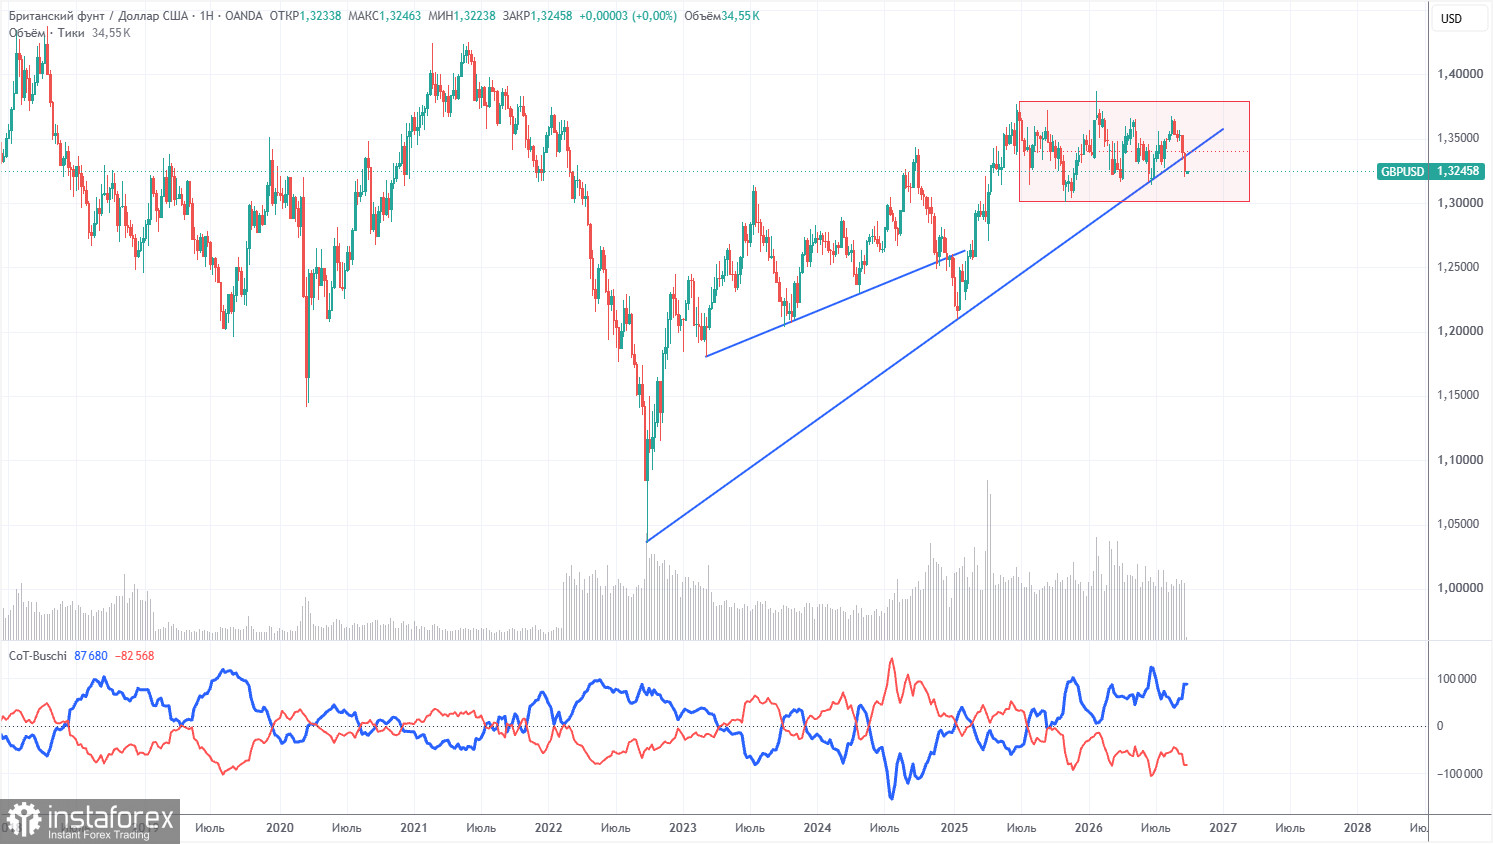
COT reports for the pound show that non-commercial traders have held net short positions for several months. The net position is negative despite the preservation of a long-term uptrend. Given events in the Middle East, it is not surprising that dollar demand was high in the first half of 2026. The war is formally over, but the conflict persists. The Fed's shifted monetary stance again supported the dollar, and the ascending trend line was breached. However, it was breached within a flat, so we do not consider the long-term uptrend to be finished.
In the long term, the dollar continues to decline due to Donald Trump's policies, which is clearly visible on the weekly TF. The trade war will continue in one form or another for a long time, and Trump's policies aim directly and indirectly to weaken the US currency. The long-term uptrend remains intact. According to the latest COT report (dated September 22), the "Non-commercial" group closed 14,900 BUY contracts and opened 8,900 SELL contracts. Thus, non-commercial traders' net position increased by 23,800 contracts over the week.
GBP/USD 1H Analysis
On the hourly timeframe, the GBP/USD pair continues to form a downward trend. The Fed's decision and stance have significantly changed the US dollar's outlook and the market's attitude toward it. We would say that for the second time this year, a "black swan" arrived, bringing unexpectedly positive news for the dollar. Thus, one should now doubt the pound's upside potential.
For September 29 we highlight the following important levels: 1.3042–1.3050, 1.3096–1.3115, 1.3179–1.3187, 1.3301–1.3309, 1.3369–1.3377, 1.3465–1.3480, 1.3588, 1.3671–1.3681. The Senkou Span B line (1.3350) and the Kijun-sen (1.3293) can also provide signals. It is recommended to move the Stop Loss to breakeven if the price moves 20 pips in the correct direction. The Ichimoku indicator lines may shift during the day, which should be taken into account when determining trading signals.
No important publications or events are scheduled in the UK today; in the US, only the JOLTS jobs-openings report for August will be released. Therefore, we do not expect strong market moves today. Now that the pound has begun a correction, it may continue toward the critical line and the trend line.
Brief summary of the above analysis:
Traders can consider the 1.3179–1.3187 area as a target for short positions if price rebounds from the Kijun-sen line or the 1.3301–1.3309 area. A rebound from 1.3179–1.3187 would allow considering 1.3293 as a target for long positions.
Explanations for Illustrations:
Support and resistance price levels are thick red lines where movement may conclude. They are not sources of trading signals.
The Kijun-sen and Senkou Span B lines are Ichimoku indicator lines transferred to the hourly timeframe from the 4-hour timeframe. They are strong lines.
Extreme levels are thin red lines from which the price has previously rebounded. They are sources of trading signals.
Yellow lines indicate trend lines, trending channels, and any other technical patterns.
Indicator 1 on COT charts shows the size of the net position of each category of traders.