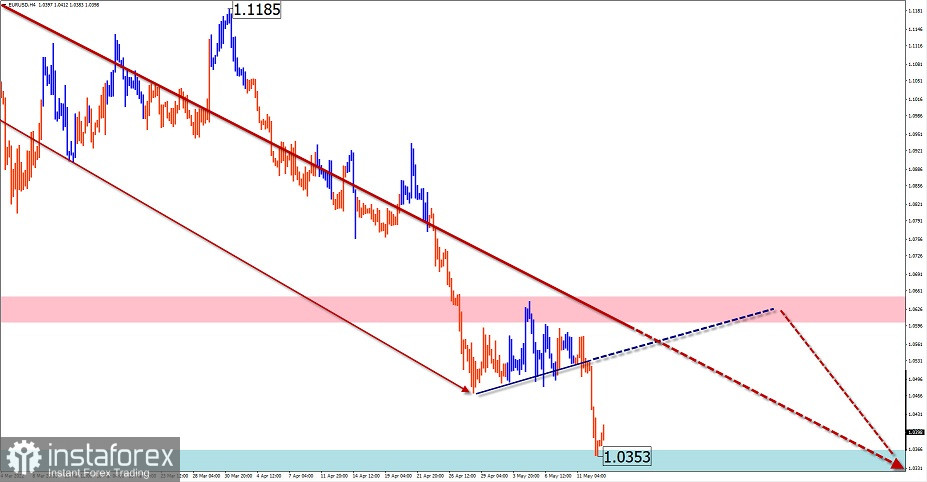
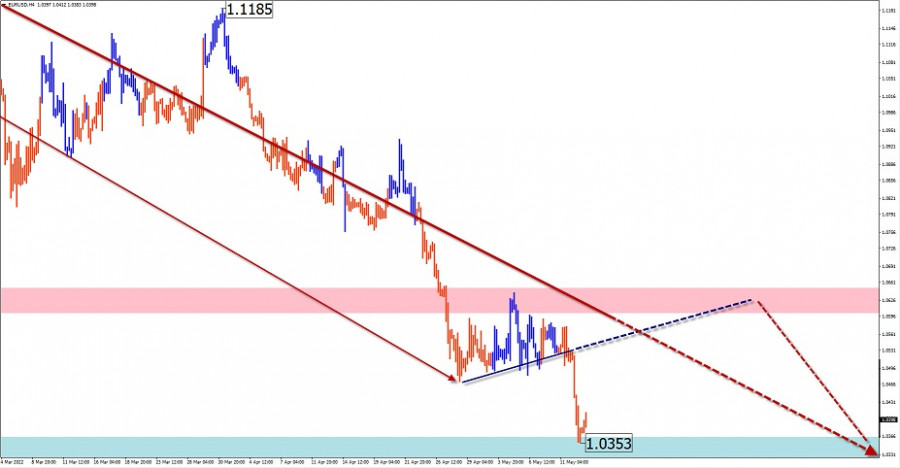
EUR/USD
Analysis:The pan-European currency chart on a large scale is a downward zigzag since the end of January 2018. The final part of wave (C) has been developing since the beginning of last year. Analysis of the structure shows its incompleteness. The price has reached the upper boundary of the strong support of the MN TF. The price movement needs to raise its wave level in a correction before continuing the decline.Outlook:Next week, the movement is expected to move predominantly sideways. The boundaries of the price corridor are marked by the settlement zones. In the coming days, ascending vector is more probable. At the end of next week, the probability of a return to the main course and a break of the support boundaries increases.Potential reversal zonesResistance:- 1.0600/1.0650Support:- 1.0370/1.0320Recommendations:For the coming week, it is recommended to keep trading on the euro market within individual trading sessions. It is safer to reduce the trading lot. In the area of estimated resistance, it is recommended to close purchases, starting to monitor trading signals to sell the instrument.
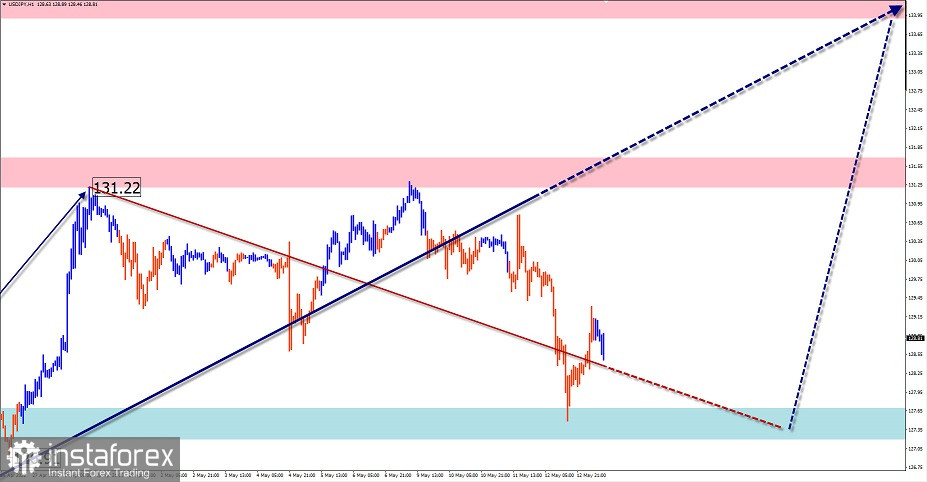
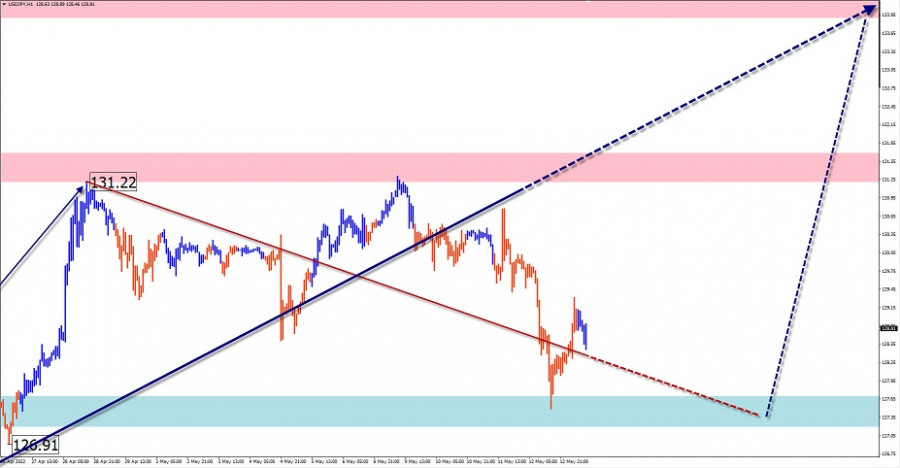
USD/JPY
Analysis:The upward momentum that started in January 2021 has brought the major Japanese yen pair quotes back to the price values of 20 years ago. A sharp depreciation of the national currency against the USD for the export-oriented Japanese economy will certainly have a positive effect on the rate of development. From the lower boundary of the strong resistance zone, the price has been drifting sideways in the last two weeks, forming an intermediate correction. In the wave structure, this section completes a fully latent correction. The price rise from May 12 has reversal potential.Outlook:Early next week, we can expect the completion of the reversal in the sideways flat and the resumption of the pair's rise. The resistance zone is located at a strong level, which will be difficult for the price to sell. After breaking through the upper boundary, growth will continue to the next zone.Potential reversal zonesResistance:- 133.90/134.40- 131.20/131.70Support:- 127.70/127.20Recommendations:Opening short positions in the Japanese Yen market is quite risky and not recommended. It is optimal to refrain from entering the pair's market until the completion of the current correction, monitoring the emerging signals of your trading system to buy the pair.
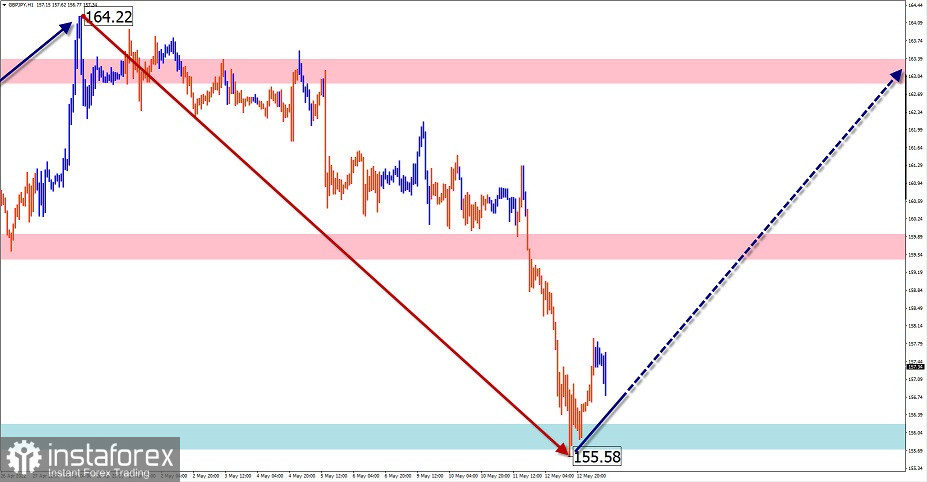
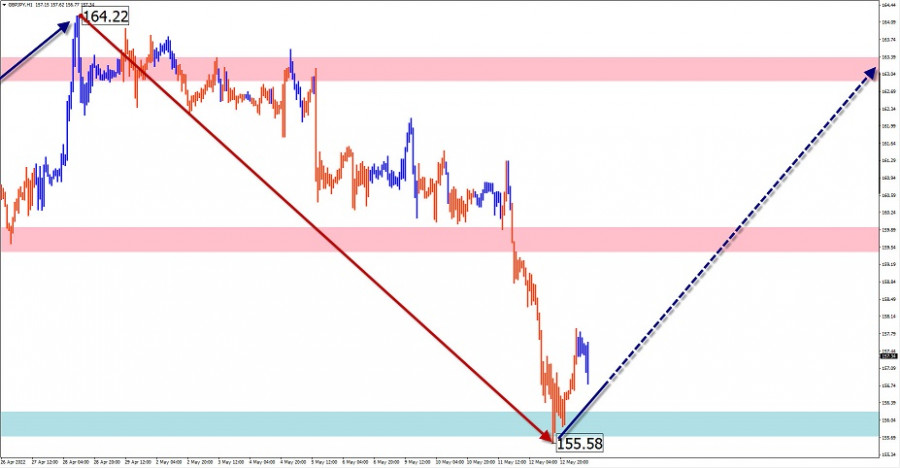
GBP/JPY
Analysis:Over the past two years, the English Pound/Japanese Yen cross has been moving north on the price chart. Having reached the potential reversal zone, from the end of March the quotations began to form a complex correction in the form of a stretched plane. By now, the structure of this wave looks completed. The price reached a strong support of the weekly chart scale. The uptrend from May 12 has reversal potential.Outlook:In the coming days of the week, sideways price movement along the boundaries of the estimated support is expected. Further, we can expect a reversal and resumption of price growth. An increase in activity is likely by the end of the week. After breaking through the upper boundary of the nearest resistance, the next zone will be the benchmark.Potential reversal zonesResistance:- 162.90/163.40- 159.40/159.90Support:- 156.20/155.70Recommendations:Opening short positions in the cross market is risky and could lead to losses. It is recommended to refrain from trading in the pair until there are buying signals confirmed by your trading system in the area of estimated support.
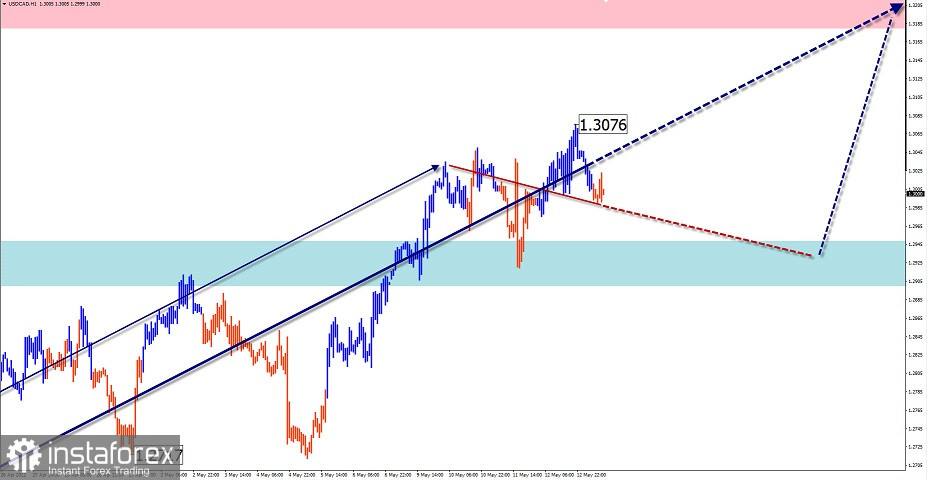
USD/CAD
Analysis:A correction is forming within the main bearish wave from the middle of June 2021 upwards. Analysis of its structure shows development of the final part (C) in recent months. A week ago, the pair's price sold a strong large scale level, which has become support.Outlook:In the coming days the pair's price is expected to move sideways, with a general downward vector. In the area of support, one can expect formation of reversal and resumption of price rise. The estimated resistance is at the lower edge of the preliminary target zone.Potential reversal zonesResistance:- 1.3180/1.3230Support:- 1.2950/1.2920Recommendations:When selling the Canadian dollar in the near term, it is advisable to limit yourself to individual trading sessions and reduce the trading lot. It is safer to refrain from transactions until there are confirmed buy signals in the support area.
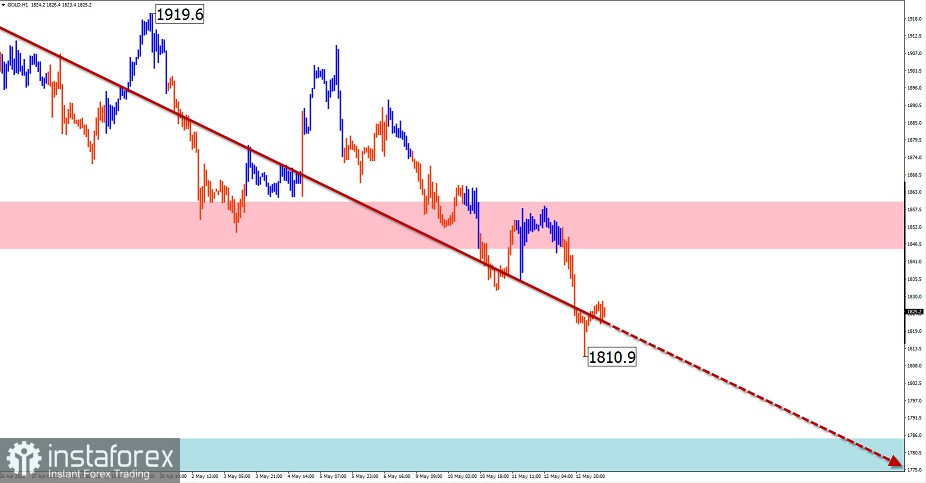
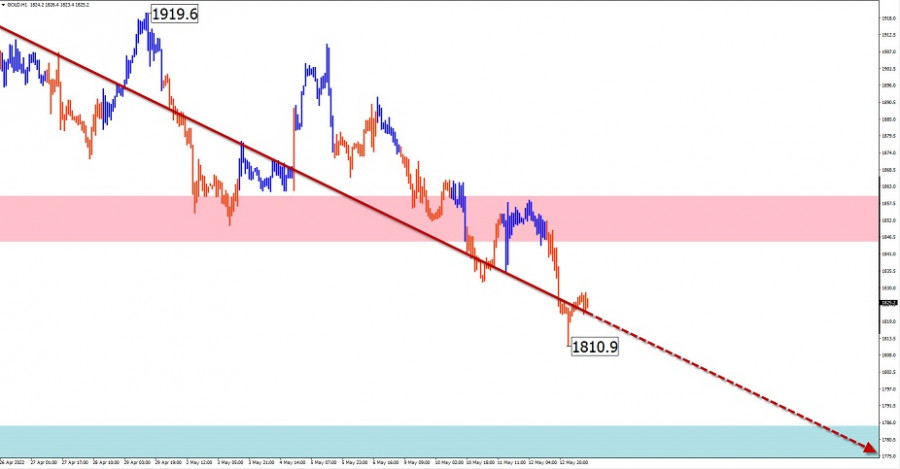
GOLD
Analysis:The downward trend in the gold market, which started in March, continues. The structure of the bearish wave is incomplete. A month ago, the final part of the zigzag wave started, which periodically forms counter pullbacks, in the form of a horizontal flat.Outlook:The start of the coming week in the gold market is expected to be quiet. An upward price pullback is probable not higher than the boundaries of the estimated resistance. Further, it is possible to expect the formation of a reversal and resumption of a bearish course. Estimated support shows the most likely price level by the end of next week.Potential reversal zonesResistance:- 1845.0/1860.0Support:- 1785.0/1770.0Recommendations:There will be no conditions for opening long positions in gold in the coming days. It is recommended to refrain from entering the market for the instrument during the upward pullbacks, tracking the sell signals at their ends.
Explanation: In simplified wave analysis (SVA), all waves consist of 3 parts (A-B-C). Only the last, unfinished wave is analysed on each TF. The solid arrow background shows the structure formed. The dotted line shows the expected movement.Attention: The wave algorithm does not take into account the duration of movements of the instruments over time!