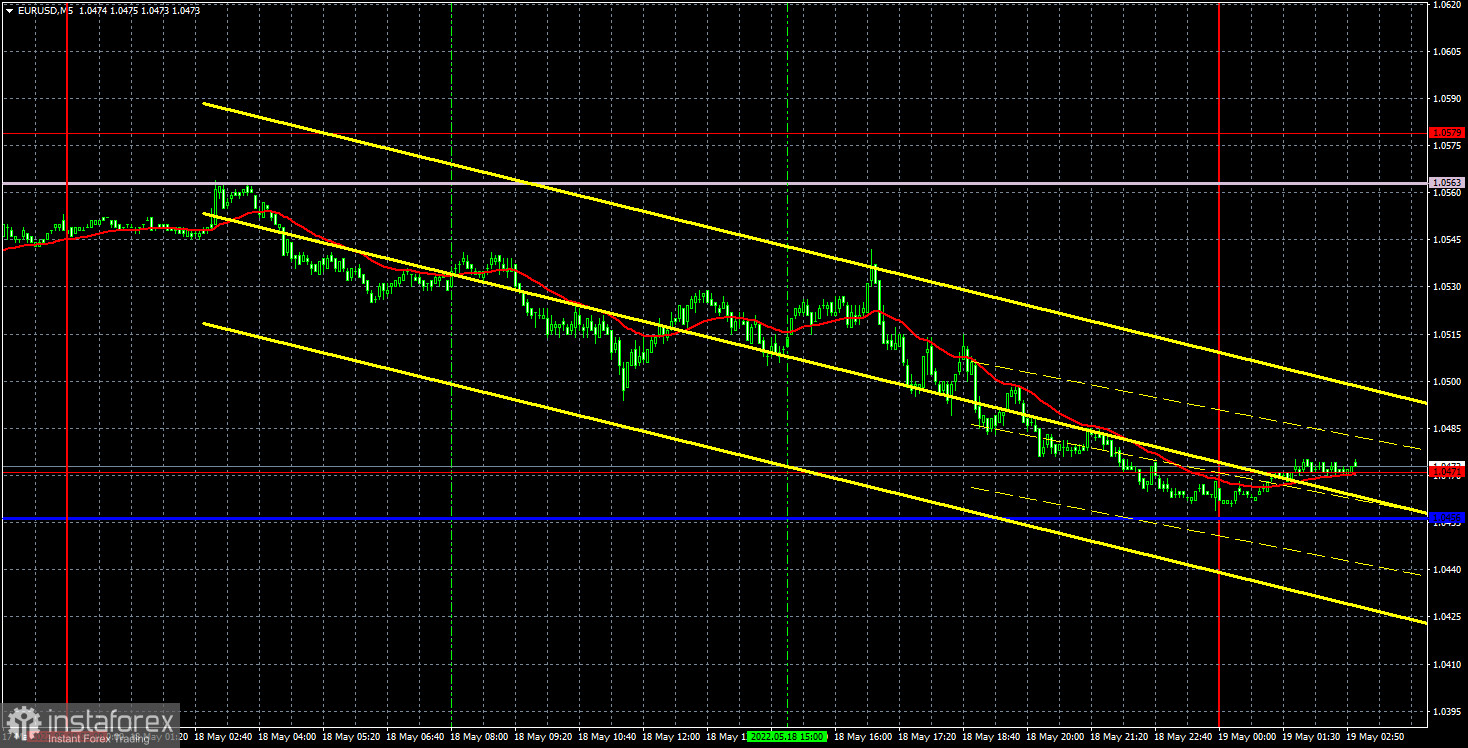
EUR/USD 5M
The EUR/USD pair began to fall rather predictably on Wednesday. There has been a fairly strong rise for the past two days, however, as we have already said, the fundamental and macroeconomic reasons for it were rather weak. Although formally the euro still had reason to grow. However, it failed to even reach the level of 1.0579, which is not far from the last local high. Perhaps, a rollback has begun now, or maybe a new entry for a strong fall. Recall that when the market cannot overcome any level for a long time, such an event as "acceleration" can occur. Traders deliberately release the pair in the opposite direction, and then begin to exert new, more powerful pressure on it. Therefore, we will not be at all surprised if the fall really resumes, and the price renews its 20-year lows. There were no important macroeconomic statistics on Wednesday. The European Union just released a report on inflation in the second estimate, which slightly differed from the first.
As for trading signals, things are not going well here. Not a single one was formed during the whole day. The pair rebounded ideally from the Senkou Span B line at night, but this signal was formed at night and could not be worked out. During the daytime, the pair continued its systematic decline to the level of 1.0471. Therefore, there seemed to be a trend movement, and volatility was considerable, but there were no signals. Unfortunately.
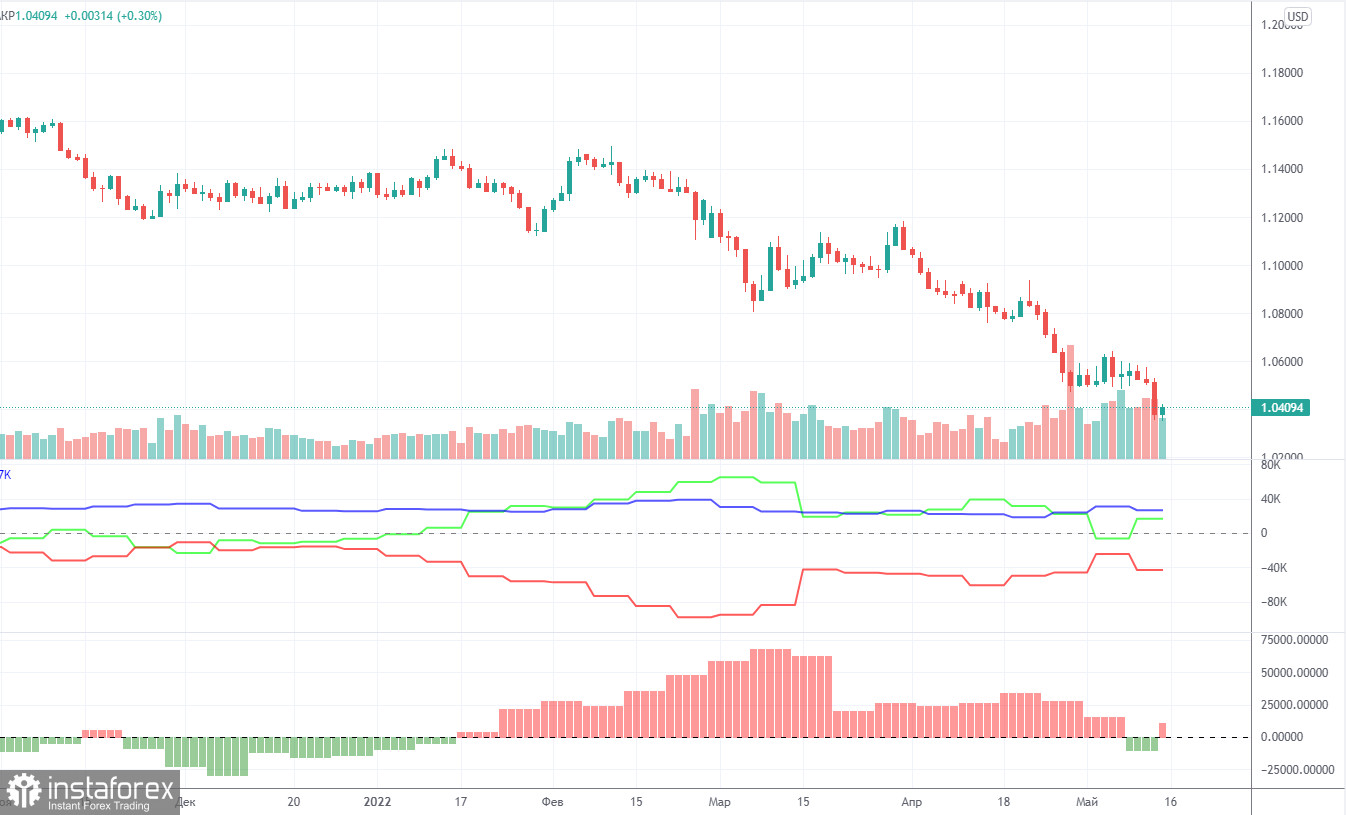
COT report:
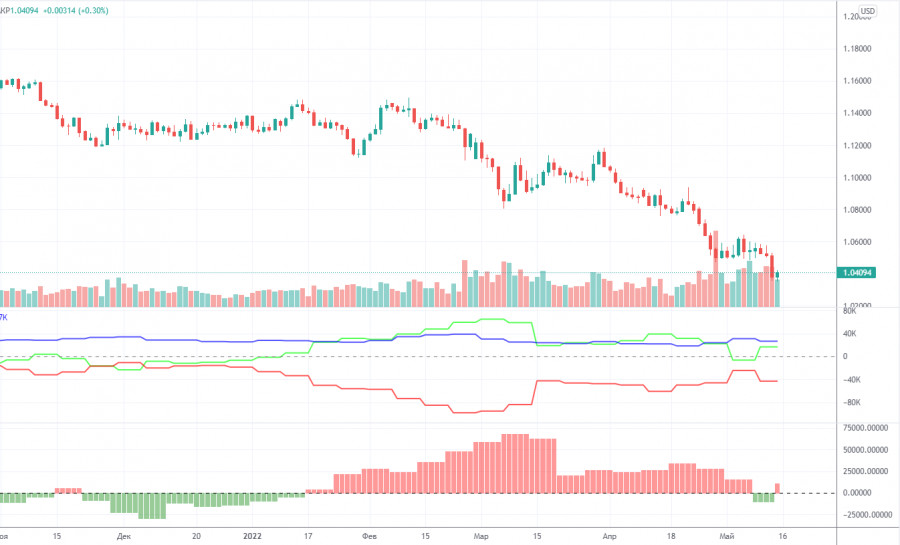
The latest Commitment of Traders (COT) reports on the euro raised more questions than they answered! The week before last, for the first time in a long time, the COT report showed a bearish mood among traders, which is logical, given the strong fall of the euro in recent months. However, the new COT report again showed an increase in bullish sentiment! During the reporting week, the number of long positions increased by 19,800, while the number of short positions in the non-commercial group decreased by 3,100. Thus, the net position grew by 23,000 positions per week. This means that the bearish mood has turned to bullish, as the number of longs now exceeds the number of shorts for non-commercial traders by 17,000. As a result, we again have a paradoxical picture in which big players buy more euros than they sell, but at the same time, the euro falls. From our point of view, this is because the demand for the US dollar is much higher than the demand for the euro. Even if someone suggested that the whole point is the weakening of the bullish mood in recent months (the second indicator is a histogram), then we recall that in the week between May 4 and 10, commercial traders opened 20,000 longs, and the euro increased by 30 points over the same period... Thus, it is still impossible to make a correlation between COT reports and what is happening in the market. Forecasts to build on such data, moreover, do not make sense.
We recommend to familiarize yourself with:
Overview of the EUR/USD pair. May 19. Sweden and Finland have applied to join NATO. Possible conflict in the Baltics.
Overview of the GBP/USD pair. May 19. Highest inflation in the UK, is it good or bad for the British pound?
Forecast and trading signals for GBP/USD on May 19. Detailed analysis of the movement of the pair and trading transactions.
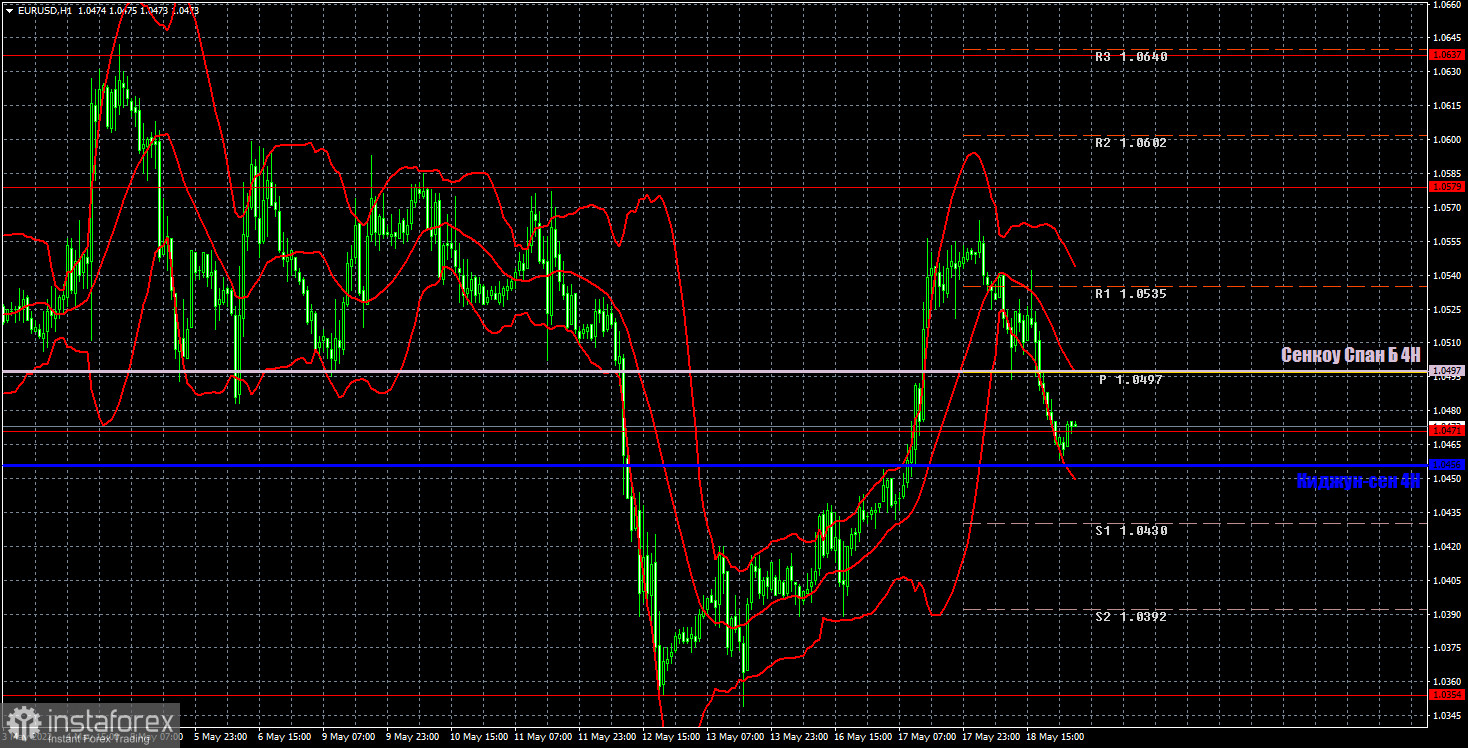
EUR/USD 1H
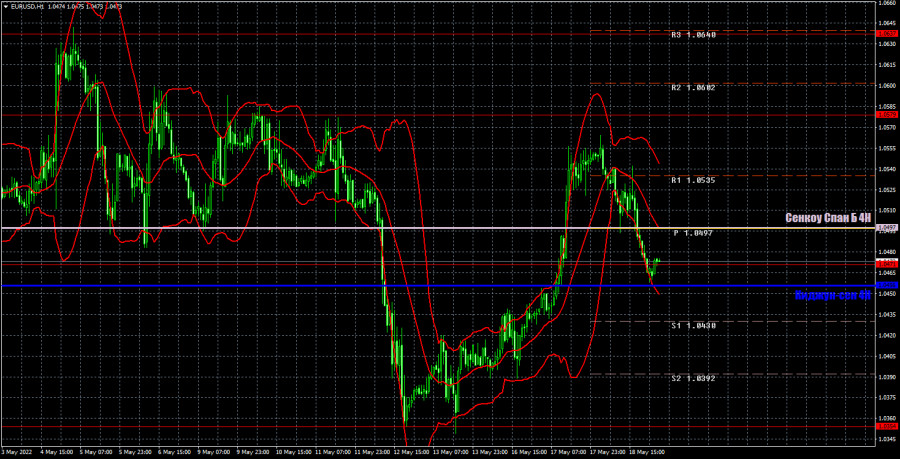
The pair showed a strong growth on the hourly timeframe, but on Tuesday it failed to overcome the Senkou Span B line, and on Wednesday it completely fell below it. Therefore, at the moment, the last significant support for the euro currency is the critical line. If it does not keep the pair above itself, then we are confident in the option of "acceleration" and the resumption of the downward trend. We highlight the following levels for trading on Thursday - 1.0340-1.0354, 1.0471, 1.0579, 1.0637, as well as Senkou Span B (1.0497) and Kijun-sen (1.0456). Ichimoku indicator lines can move during the day, which should be taken into account when determining trading signals. There are also secondary support and resistance levels, but no signals are formed near them. Signals can be "rebounds" and "breakthrough" extreme levels and lines. Do not forget about placing a Stop Loss order at breakeven if the price has gone in the right direction for 15 points. This will protect you against possible losses if the signal turns out to be false. The European Union is set to publish a report on the monetary policy of the European Central Bank, and in the US - applications for unemployment benefits. Both of these reports are not significant, so they are unlikely to provoke a market reaction. So today nothing will prevent traders from showing what they want from the pair.
Explanations for the chart:
Support and Resistance Levels are the levels that serve as targets when buying or selling the pair. You can place Take Profit near these levels.
Kijun-sen and Senkou Span B lines are lines of the Ichimoku indicator transferred to the hourly timeframe from the 4-hour one.
Support and resistance areas are areas from which the price has repeatedly rebounded off.
Yellow lines are trend lines, trend channels and any other technical patterns.
Indicator 1 on the COT charts is the size of the net position of each category of traders.
Indicator 2 on the COT charts is the size of the net position for the non-commercial group.