4-hour timeframe
Technical data:
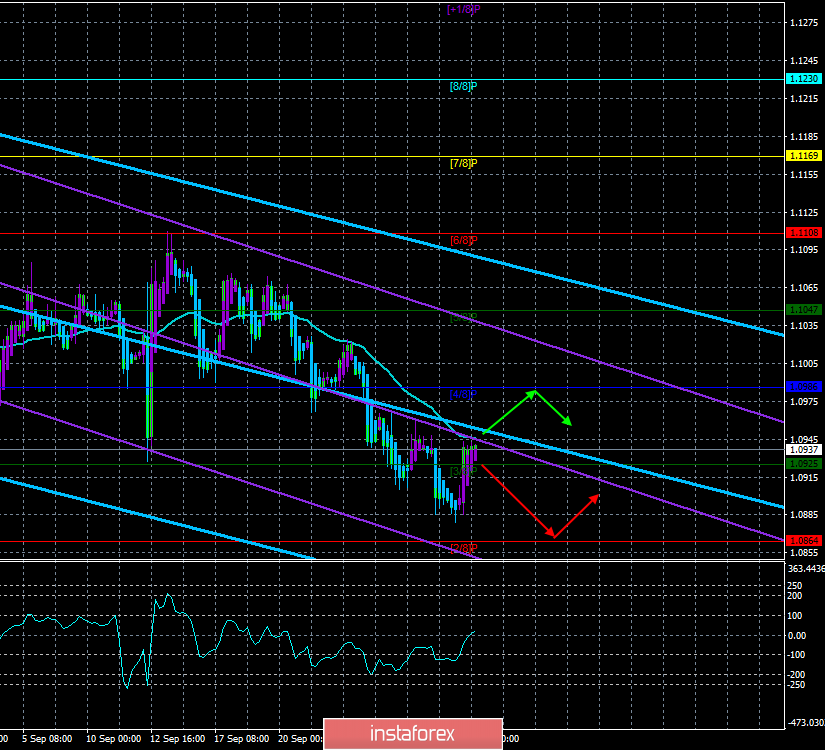
The upper channel of linear regression: direction – down.
The lower channel of linear regression: direction – down.
The moving average (20; smoothed) – sideways.
CCI: 17.6825
The second trading day of the week for the EUR/USD pair was more positive than the first. The euro managed to adjust to the moving average line, and only thanks to a single macroeconomic report from overseas.
European macroeconomic statistics, as always, disappointed. The indices of business activity in the areas of production in Germany and the European Union were slightly better than the forecast values, but still very weak. Therefore, the euro in the European trading session continued to fall calmly. Then inflation was published in the European Union, its preliminary value for September. There were no surprises here either. The main indicator slowed even more to 0.9% y/y, the base indicator accelerated slightly to 1.0% y/y. However, as in the case of indices of business activity, in any case, such weak values of the consumer price index a priori could not cause the purchase of the euro. Thus, the hopes of traders who want to buy the euro on October 1 were associated only with data from the United States. For the American dollar at first, nothing boded trouble. The Markit business activity index remained above the key value of 50.0 and even slightly exceeded the forecast of 51.1. But, unfortunately, a similar index from ISM dropped very much, which is considered more important and significant. Its value is 47.8, while an increase to 50.1 was expected. It is this index, signaling problems in the manufacturing sector of America and proving that in the United States is not as good as it seems to traders, and caused a sharp closure of "dollar" positions in the Forex market, which led to a noticeable strengthening of the euro.
What are the prospects of the euro – that is the question. Yesterday, the data from America were not the best, but European statistics failed again. It is on this basis that we believe that the balance of power between the euro and the dollar has not changed at all. Moreover, at the moment, the euro/dollar pair has not even managed to overcome the moving average, so it makes no sense to talk about anything more than a correction now.
Today will be a very boring day in terms of macroeconomic statistics. Only one significant report will be published – the change in employment from ADP. On the other hand, it might even be a good thing. If the euro today will be able to gain a foothold above the moving average with a virtually empty calendar, it will mean that the bulls are still willing to make some efforts to lift the euro up.
From a technical point of view, the EUR/USD pair has worked out the moving average and should either bounce off of it and resume the downward trend or overcome it and go into a deeper correction. Both linear regression channels still indicate a downward trend.
Nearest support levels:
S1 – 1.0925
S2 – 1.0864
S3 – 1.0803
Nearest resistance levels:
R1 – 1.0986
R2 – 1.1047
R3 – 1.1108
Trading recommendations:
The euro/dollar pair started a new round of corrective movement. Thus, it is recommended to wait for the completion of the correction and resume selling the euro with the target of Murray's level of "2/8" - 1.0803. Purchases of the pair can be considered very small lots, if the bulls manage to overcome the moving average today, with a target of 1.0986.
In addition to the technical picture, fundamental data and the time of their release should also be taken into account.
Explanation of the illustrations:
The upper channel of linear regression – the blue lines of the unidirectional movement.
The lower channel of linear regression – the purple lines of the unidirectional movement.
CCI – the blue line in the indicator window.
The moving average (20; smoothed) – the blue line on the price chart.
Support and resistance – red horizontal lines.
Heiken Ashi – an indicator that colors bars in blue or purple.