4-hour timeframe
Technical data:
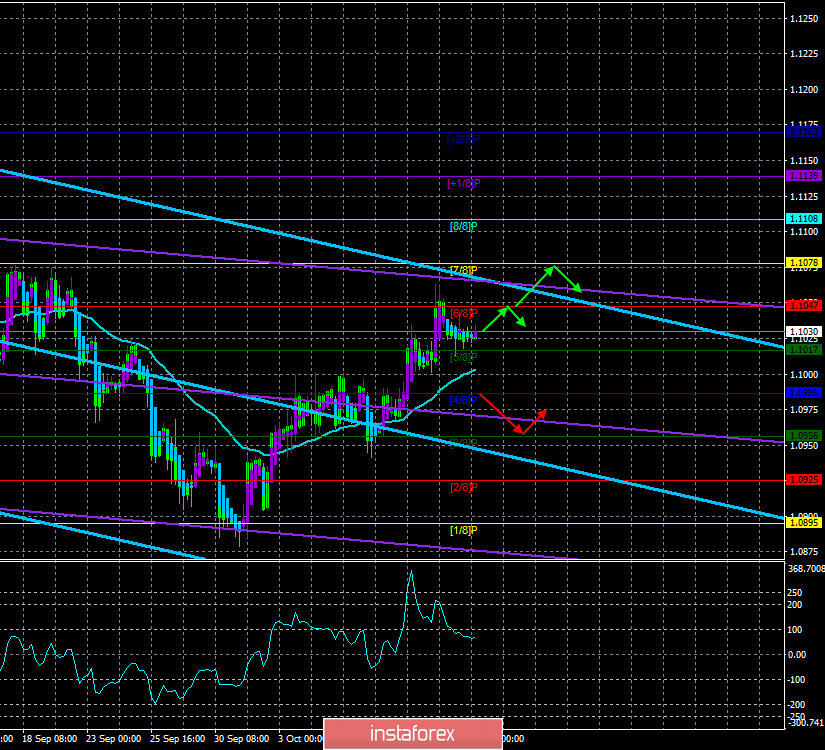
The upper channel of linear regression: direction – down.
The lower channel of linear regression: direction – down.
The moving average (20; smoothed) – up.
CCI: 63.4289
The EUR/USD currency pair was adjusted throughout the first trading day of the week. The correction was very weak, and volatility – low. According to the results of the day, it was not even possible to reach the moving average line, which all this time was moving towards the price. However, this is the normal state of the market on Monday. Although one macroeconomic report (industrial production in the eurozone) was published, traders found no reason to continue buying the euro, nor to resume the downward trend.
Today, from a fundamental point of view, there will be almost nothing to pay attention to again. A study of the ZEW Institute, an index of economic sentiment for October, and an index of business sentiment across Germany will be published in the European Union. These indicators are similar to business activity indices, which "predict" the future. And only by looking at the figures of the previous period and forecasts for these two reports, it becomes clear that nothing positive can be expected. Both indices are in the deep red. Thus, due to macroeconomic reports, the euro currency will not receive support today.
As for other macroeconomic events, there is also nothing to note. As we have repeatedly said, the topic of the US-China trade war is certainly very interesting, but until it is reflected in the specific economic indicators of the US economy, it remains just an interesting topic. Yesterday's statements by Trump about the progress in negotiations and the proximity of signing an agreement in the "first phase" tomorrow may be replaced by angry rhetoric and new accusations against Beijing. Thus, we recommend not to pay too much attention to the Beijing-Washington trade relations.
Thus, two key themes remain – the Fed rate and the ECB rate. At the end of the month, there will be a reshuffle in the ECB Board, Christine Lagarde will take up her duties, then we can expect any changes in monetary policy. Although what changes can be expected? Tightening? Hardly. Another easing of monetary policy? It will depend on the actions of Draghi and members of the monetary committee at the meeting in October. If the rate is lowered again, then Christine Lagarde will have very little room for maneuver.
In general, we believe that the situation in the eurozone remains at the same level and is getting worse every month. Thus, the euro currency again only with great difficulty looks through the prospects of forming an upward trend against the US dollar. From a technical point of view, long positions remain relevant, as the pair remains above the moving average. However, we do not recommend buying a pair in large volumes.
Nearest support levels:
S1 – 1.1017
S2 – 1.0986
S3 – 1.0956
Nearest resistance levels:
R1 – 1.1047
R2 – 1.1078
R3 – 1.1108
Trading recommendations:
The euro/dollar pair continues to be located above the moving average line but is being corrected at the moment. Thus, it is recommended to wait for the completion of the current correction and resume buying the euro currency in small lots with targets of 1.1047 and 1.1078. It is recommended to buy the US dollar if the bears overcome the moving average.
In addition to the technical picture, fundamental data and the time of their release should also be taken into account.
Explanation of the illustrations:
The upper channel of linear regression – the blue lines of the unidirectional movement.
The lower channel of linear regression – the purple lines of the unidirectional movement.
CCI – the blue line in the indicator window.
The moving average (20; smoothed) – blue line on the price chart.
Murray levels – multi-colored horizontal stripes.
Heiken Ashi – an indicator that colors bars in blue or purple.