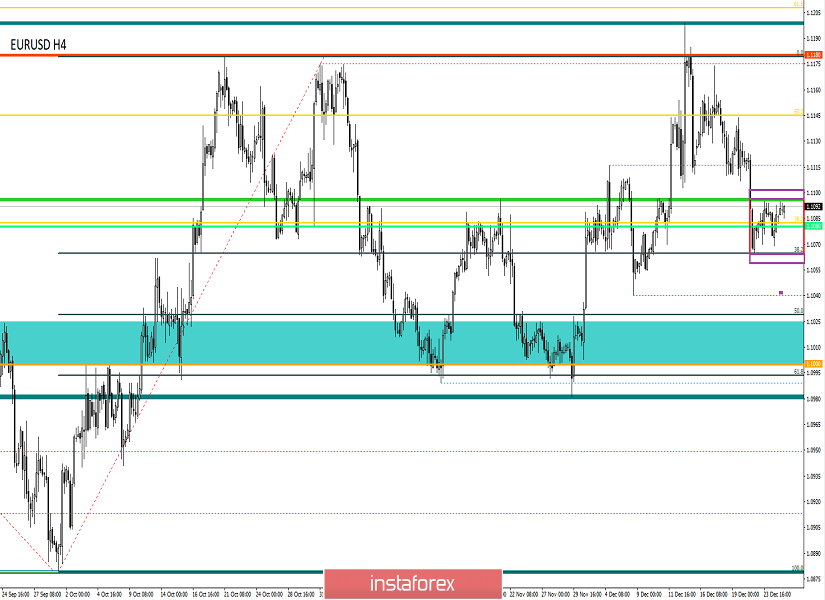
From the point of view of a technical analysis, we see that from the beginning of the trading week, the EUR / USD currency pair conditionally moved to the stage of a sluggish movement, where the value of 1.1080 plays the role of a mirror level, relative to which the range of 1.1065 / 1.1095 is built. In fact, we are witnessing a kind of decline in trading volumes caused by the festive week, where the quote is trying to consolidate for a while until major players again return to the market. Thus, the absence of leading participants suggests not trading, as the prospect of expectations is extremely small, and the risk of worthless transactions is high. But there it was, speculators were hoping for a finishing chord, using a narrow market as a lever for local leaps. From here the theory began to arise everywhere,
12/24/18 - 12/31/18 = 69 points [daily average candle]
12/26/17 - 12/31/17 = 61 p.
12/26/16 - 12/31/16 = 83 p.
12/28/15 - 12/31/15 = 64 p.
12/26/14 - 12/31/14 = 63 p.
12/26/13 - 12/31/13 = 91 p.
12/26/12 - 12/31/12 = 75 p.
12/26/11 - 12/31/11 = 87 p.
12/27/10 - 12/31/10 = 133 p.
12/28/09 - 12/31/09 = 101 p.
12/26/08 - 12/31/08 = 278 p.
12/26/07 - 12/31/07 = 139 p.
12/26/06 - 12/29/06 = 76 p.
12/26/05 - 12/30/05 = 83 p.
12/27/04 - 12/31/04 = 105 p.
12/26/03 - 12/31/03 = 89 p.
12/26/02 - 12/31/02 = 82 p.
12/26/01 - 12/31/01 = 95 p.
12/26/00 - 12/29/00 = 119 p.
It is worth considering that the market dynamics have changed over the years and, for example, from 2000 to 2009 we had an average daily candle of 118 points, and in the period 2010 to 2018 it was only 106 points. Having statistical data, it can be assumed that in the current period, daily average volatility can break out of the framework of stagnation and still show remarkable values.
As discussed in the review on December 24, traders moved to the stage of partial fixation of short positions at the time of the initial approximation of the quotes to the level of 1.1080. The next steps were in the waiting stage, where special attention was paid to the area of 1.1060 / 1.1065, for clear price-fixing.
Considering the trading chart in general terms during the daily period, we see that the global trend is always downward, but the clock component is at the stage of elongated correction.
The was no news background on December 24 and 25 due to the celebration of Christmas.
In terms of informational background, we had a conditional lull, however, there is still something to read. So, last Tuesday, the White House announced that the signing of the first phase of the trade agreement between the United States and China will be in terms of a ceremony where two leaders will be present.
"Yes, the ceremony will take place when we meet. The transaction is completed. Now its text is being translated," said Donald Trump.
In turn, Beijing did not confirm that a meeting of the two leaders was planned. Earlier, it was generally said that the document would be signed by the ministers of the two countries. Let me remind you that the agreement of 86 pages has not yet been made public, and the completion of legal procedures will be completed in early January.
Today, in terms of the economic calendar, we have acquired data on applications for unemployment benefits in the United States, where they are expected to reduce in Primary by 10 thousand and on Repeated by 31 thousand. At the same time, it is worth considering in the work of the factor that Europe continues to rest today, celebrating the "Boxing Day" holiday, thereby this can affect trading volumes.
Further development
Analyzing the current trading chart, we see the same fluctuation within 1.1065 / 1.1095, where the quotes develop within the upper limit without undue enthusiasm. In fact, the lack of the proper amount of trading volumes speaks for itself, and all hopes remain only for speculative interest, which in the thin market can help move the quotes off the ground.
By detailing the time interval per minute, we see that at the moment the amplitude is 10 points, and the structure of the candles is similar to an inactive trading session.
In turn, the bulk of the traders relax, having some short positions on deposit. Complete closure of trade transactions, in this case, will not be considered a mistake, sometimes it is better to wait. In turn, speculators are trying to confirm the theory of the thin market in the hope of revealing the leaps of the outgoing year.
It is likely to assume that the horizontal movement of 1.1065 / 1.1095 will still remain on the market, having small allowances designed for punctures by shadows. If you are a speculator and can not sit still, then it is worthwhile to carefully analyze the behavior of the quotes and the structure of the candles, identifying characteristic impulses. The analysis will be conducted on periods M30 and H1, and the control values are 1.1100 and 1.1078.
Based on the above information, we derive trading recommendations as follows:
- Buy positions are considered in case of a price exit higher than 1.1105.
- Many traders already have sale positions; refilling is considered in the region of 1.1065-1.1060.
Indicator analysis
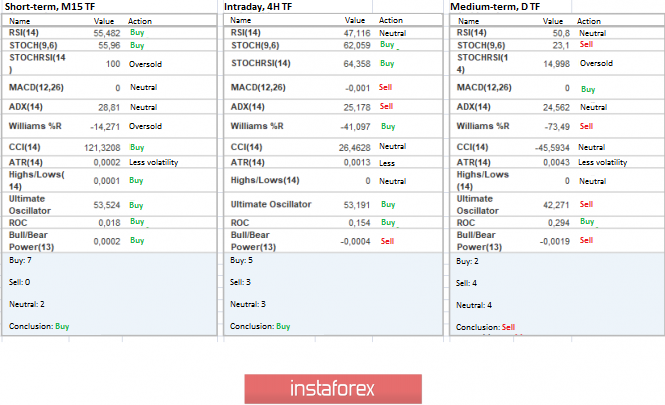
Analyzing a different sector of timeframes (TF), we see that indicators of relatively shorter periods are more prone to neutral interest than to upward, due to the slowdown process. In turn, the medium-term outlook holds a downward interest and is also on the verge of a neutral nature.
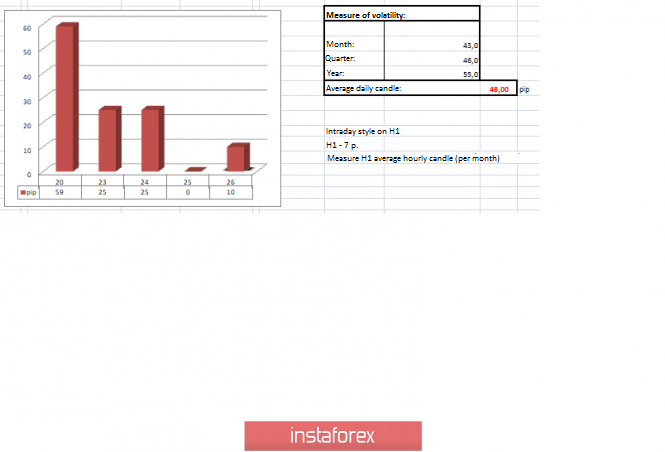
Volatility per week / Measurement of volatility: Month; Quarter Year
Measurement of volatility reflects the average daily fluctuation, calculated for the Month / Quarter / Year.
(December 26 was built taking into account the time of publication of the article)
The volatility of the current time is 10 points, which is a low indicator for this time section. It is likely to assume that if speculators fail to take advantage of the thin market situation, then due to the absence of leading players, volatility is still low.
Key levels
Resistance Zones: 1.1180 *; 1.1300 **; 1.1450; 1.1550; 1.1650 *; 1.1720 **; 1.1850 **; 1,2100
Support Areas: 1,1080 **; 1,1000 ***; 1.0900 / 1.0950 **; 1.0850 **; 1,0500 ***; 1.0350 **; 1,0000 ***.
* Periodic level
** Range Level
*** Psychological level
***** The article is built on the principle of conducting a transaction, with daily adjustment