From the point of view of a comprehensive analysis, we see a slowdown that occurred at the time the price entered the area of the psychological level of 1.3000. That is, the control level which has its own oscillation amplitude in question, and in this case, the scope is 1.2950 / 1.3015. In fact, the quote managed to draw closer to the lower border, but the story literally repeated itself. The pattern, which took place on January 13-14, affected the current behavior of the quote, where a local rebound was obtained in the same way. It is extremely early to put an end to a downward course, since one should not forget that even an inertial move needs its own stops and regroupings of trading forces, otherwise it doesn't.
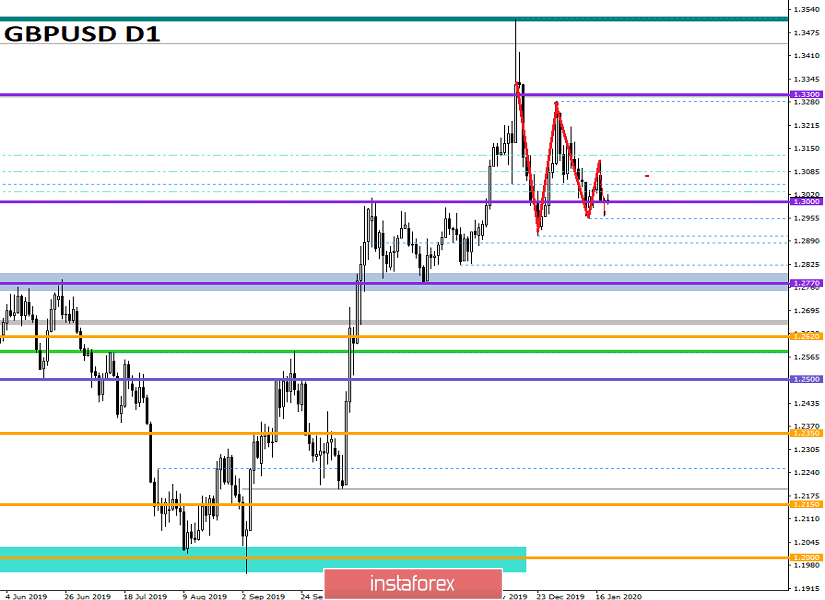
In terms of the theory of the Zigzag-shaped model [03.12.19-17.01.20; D1], we see that there are prerequisites for further formation, that is, even more compression. Earlier, we assumed that the last measure was enough for compression, but it wasn't there. The quote is considering the last move and plans to build another phase equal to the middle of the last - the control value for this phase is 1.3038. Let me remind you that there are now three correction phases in the structure of the Zigzag-shaped model, where the first is 609 points, the second phase is already 329 points, and the third phase is 155 points.
[Below is a daily chart where all bars of the Zigzag-shaped model are highlighted in red lines]
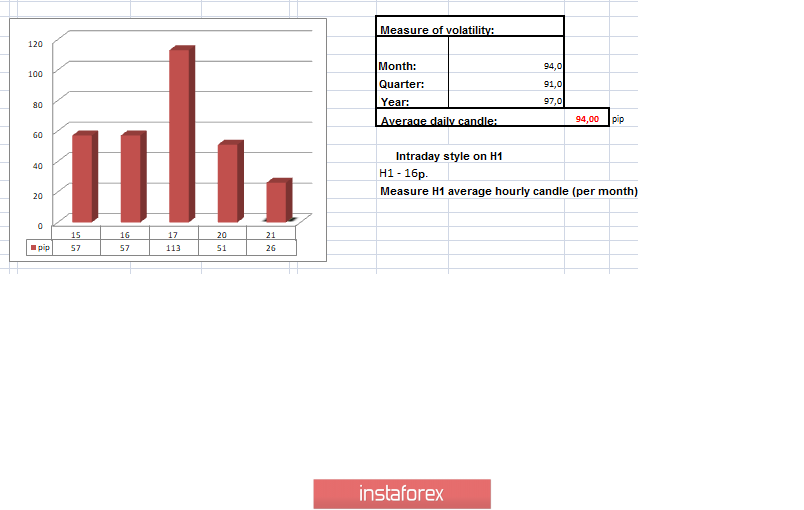
In terms of volatility, we see an extremely interesting pattern. The volatility declined again after the quotes switched to modeling the Zigzag-shaped model. At the same time, its average daily value is close in size to the days earlier, [see the table of volatility at the end of the article]. Everything that happens is very similar to a willingness to jump, the spring in the form of a Zigzag-shaped model is compressing more and more, thereby a surge of activity awaits us in the near future.
Analyzing every minute on Friday, we see that there was a residual inertial move at first, which managed to lower the quote to within 1.2961. After that, the process of reversal has begun against the background of local oversold, which came last Friday.
As discussed in a previous review, traders closed their short positions as soon as the price entered the psychological level of 1.3000 due to the risk of a possible rebound. Moreover, further short positions were considered in case of price fixing below the 1.2950 / 1.2955 area, which did not happen.
Considering the trading chart in general terms [the daily period], we see subsequent downward bars at the top of the medium-term upward trend. The nearest local pivot point is 1.3000, the resistance point is 1.3300.
The news background of the past day did not have statistics, but at the same time, the United States had a day off in connection with the celebration of Martin Luther King Day.
In terms of general informational background, we have comments from the European Union regarding correctional sanctions in case of failure to fulfill future trade conditions between Britain and the EU. The European Union believes that any agreement with the United Kingdom on relations after Brexit should include possible fines for violations of the pact. All future disputes between the EU and Britain should be resolved through an arbitration panel with the power to impose a lump sum or a fine on the violating party. Let me remind you that the transitional period, where all trade agreements between Britain and EU should be developed, will come soon and will last until the end of the year.

Today, in terms of the economic calendar, we have data for the UK, where they will publish an indicator of the unemployment rate, which should be 3.8% [forecast unchanged]. At the same time, the average salary, excluding premiums, is expected to decline from 3.5% to 3.4%, but the number of applications for unemployment benefits is reduced by 6.2 thousand.
Further development
Analyzing the current trading chart, we see a kind of pullback and price fixing above the psychological level of 1.3000. In fact, the price conditionally remains in the same range, showing little activity, where the theory of the Zigzag-shaped model may have moved to the finishing phase.
In terms of the emotional mood of the market, we see a little restraint, but speculative interest is still high, which means the emergence of new trading volumes.
By detailing the per minute portion of time, we see a distinct pullback structure that originated in the afternoon of the past day.
In turn, speculators consider local long positions from the value of 1.015 in the direction of 1.3038. The main positions remain in a downward direction so far, but the quote needs to be fixed below the 1.2950 / 1.2955 area for it to continue.
Having a general picture of actions, it is possible to assume that the theory of compression continues to develop in the market, where local upward jumps are possible, but with the preservation of the general downward mood. In this case, it is not advisable to work with large trading volumes and choose a more conservative method of money management. Moreover, downward positions are in priority, but we can probably see them only after the execution of the Zigzag-shaped model.
Based on the above information, we derive trading recommendations:
- Buy positions are considered in terms of the local move to 1.3038, in the form of a model structure.
- Sell positions are considered if prices are fixed below the 1.2950 / 1.2955 area, with the first prospect of a move to 1.2904. An extension is also made to 1.2885-1.2770, after the breakdown of the first point and fixation below it.
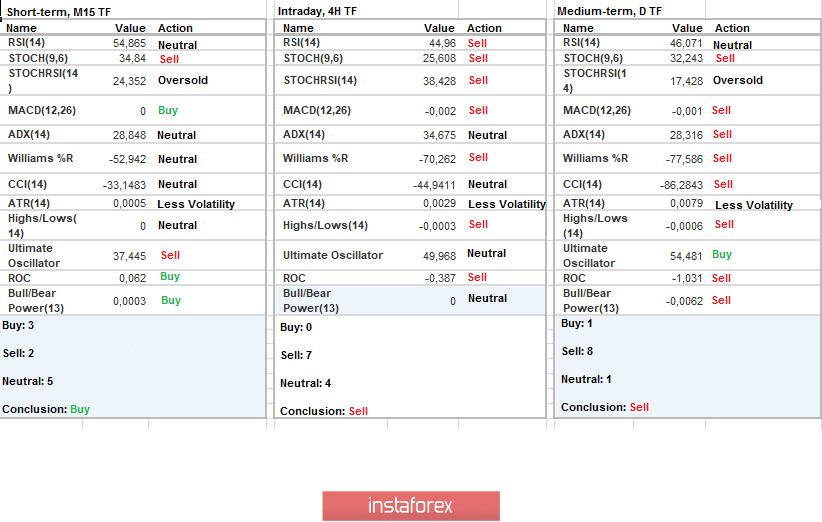
Indicator analysis
Analyzing a different sector of timeframes (TF), we see that the general downward interest is still preserved in terms of technical instrument. There is only a neutral upward interest in the minute periods.
Volatility per week / Measurement of volatility: Month; Quarter; Year
Measurement of volatility reflects the average daily fluctuation, calculated for the Month / Quarter / Year.
(January 21 was built taking into account the time of publication of the article)
The current time volatility is 26 points, which is still an extremely low indicator. It is likely to assume that if the Zigzag-shaped model is still completed, then the increase in volatility and the breakdown of key values will come very quickly.
Key levels
Resistance Zones: 1.3000; 1.3180 **; 1.3300 **; 1.3600; 1.3850; 1.4000 ***; 1.4350 **.
Support Areas: 1,3000; 1.2885 *; 1.2770 **; 1.2700 *; 1.2620; 1.2580 *; 1.2500 **; 1.2350 **; 1.2205 (+/- 10p.) *; 1.2150 **; 1,2000 ***; 1.1700; 1.1475 **.
* Periodic level
** Range Level
*** Psychological level
**** The article is built on the principle of conducting a transaction, with daily adjustment