Using complex analysis, we can see a long-awaited impulse movement after a painful stagnation, where the quote has grown by more than 100 points in a few hours. For almost two days, the quote wandered within the psychological level of 1.3000, having not just a low activity, but also its absence. The signal of the upcoming acceleration was the dynamics of volatility for January 29, which was only 39 points, which is one of the lowest values in history. This kind of compression indicates a strong imbalance of trading forces, where the slightest noise can cause a local jump in activity, which happened in the market.
Regarding the zigzag-shaped model theory, everything was not as simple as we wanted. The completion of the model did not happen, due to the absence of a tipping formation. In fact, the previous phases of the model are still out of reach of the price. There were no consolidations. If we discuss a possible new compression phase within the model, the stop coordinates are within the 70-80% of the previous move, i.e. the value of 1.3112– 1.3131. At the same time, if we analyze the coordinates of the fracture of the model, we get the following areas: 1.3170-1.3280 - fracture in the upward direction; 1.2960-1,2904 – fracture in the downward direction.
In terms of volatility, we see a significant acceleration, where compared with that of the day before, we have an increase in activity three times. Meanwhile, in the case of the average daily indicator, there is an increase of 42%.
Detailing the past day by the minute, we see that the jump in activity occurred during the period of 11:00-13:00 London time [time on the trading terminal]. After that, a relatively narrow range of 1.3074-1.3108 was formed.
As discussed in the previous review, the tactic of sitting outside the market has paid off. Traders waited for the breakout of one of the interaction control values [1.2960 & 1.3040-45], where they successfully entered the market and took a solid profit.
Looking at the trading chart in general terms [the daily period], we see that there were no drastic changes when the price once again approached the psychological level of 1.3000. The quote still continues to wander in the conditionally sideways corridor, relative to seven weeks.
The news background of the previous day included data on applications for unemployment benefits in the United States. Although changes were not expected, they have occurred. Thus, initial applications fell by 7 thousand, while repeated ones surprised everyone with a decrease of 44 thousand. Meanwhile, there was no market reaction to good performance in the States for other reasons, so the focus of the last day was the Bank of England's meeting, where as predicted, the interest rate was left unchanged at 0.75%. This decision was expected for many factors, but the noise before the meeting in the media was fanned strong, claiming that the moment has come and that we will see 0.50%. The moment is indeed near, but let's remember the earlier statements of the regulator saying that actions will not be taken immediately, and that the hint was not about the beginning of the year. Based on the reports from the Bank of England, the distribution of votes on the rate remained the same [7-2], which upset many followers of the rate cut. At the same time, Mark Carney, who is leaving his post, outlined the regulator's poor views on the economic prospects of the United Kingdom which they are monitoring. In fact, the move to reduce the rate has already been made, but due to caution, changes in the Bank's policy will take place slowly.
The market reaction to the results of the Bank of England meeting was in terms of local strengthening of the pound, due to the lack of rate cuts and specifics. The most interesting point was that the surge in activity occurred half an hour before the meeting results, which questions who leaked the information.
In terms of the general information background, we have a freedom-inspired Boris Johnson, who loudly declares a bright future for a strong and purposeful country, after Brexit
"The most important thing to say today is that this is not the end, but the beginning. This is the moment when the dawn breaks and the curtain rises for the start of a new act. This is a moment for real national renewal and change, " says British Prime Minister Boris Johnson.
However, do not forget that this great power is now facing a transition period, which will be extremely difficult and ambiguous with a strict framework.
The upcoming trading week, in terms of the economic calendar, is expected to be rich. We have a stream of statistical data, centered on the report of the United States Department of Labor, which will certainly interest market participants.
The most interesting events are displayed below - - - >
Monday, February 3
UK 10:30 London time – the Index of business activity in the manufacturing sector (PMI): Pred. 49.8 - - - > Forecast 47.6
US 15:00 London time - manufacturing PMI (PMI) from ISM (Jan): PREV. 47.2 - - - > Forecast 48.0
Tuesday, February 4
UK 10:30 London time - index of business activity in the construction sector (Jan): PREV. 44.4 - - - > Forecast 45.9
US 16:00 London time - volume of industrial orders
Wednesday, February 5
UK 10:30 London time - business activity index in the service sector (Jan): PREV. 52,9--- > Forecast of 49.1
US 14:15 London time - ADP report on private sector employment (Jan): PREV. 202K - - - > Forecast 155K
US 16:00 London time - ISM business activity index in the service sector (Jan)
Friday, February 7
US 14:30 London time - unemployment rate
US 14:30 London time - report of the United States Department of Labor: PREV. 145K - - - > 156k Forecast
Further development
Analyzing the current trading chart, we can see the still-holding upward interest that was held on the market yesterday, during the initial impulse movement. The quote has already reached the area of 70-80% relative to the previous move, which concentrates special attention on itself. In fact, the current location of the price puts traders at a possible risk of breaking the Zigzag-shaped model in the upward direction. In this case, you should not jump to conclusions, since in terms of the main movement, the quote must take a position in the interaction range of 1.3170-1.3280. Otherwise, without this, we will still be in the Z-model, which means that there is a certain return movement.
From the emotional mood of the market, we can see a high coefficient of speculative positions, which is understandable, as we stood still for several days.
Detailing the minute-by-minute time period, we see that the range of 1.3074-1.3108 fell during the start of the European trading session, having a number of impulse rising candles.
In turn, speculators actively closed the previously short positions, since the risk of a reversal is high, and the existing profit is already higher than all expectations.
Having a general picture of actions, there is a possibility that further actions will depend on the behavior of the quote relative to the current values. So, the first assumption is that we have a local overbought due to acceleration, together with the Zigzag-shaped model that still remains, where a descent to the area of 1.3050 will be very possible. The second scenario meanwhile is based on the fact that the Z-model has come to completion and is waiting for its fracture, so it is worth monitoring the behavior of the quote relative to the area of 1.3170-1.3280.
Based on the above information, we will output the following trading recommendations:
- Buy positions are considered if the price fixes higher than 1.3170.
- Sell positions are considered in the reverse plan, where positions with less trading volume can be considered in the area of 1.3100.
Indicator analysis
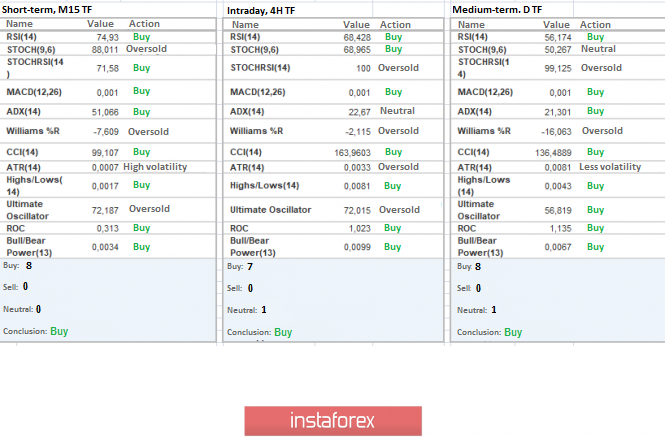
Analyzing the different sectors of timeframes (TF), we see that due to the last jump, the indicators of technical instruments have changed their downward mood to an upward one, relative to all major time periods.
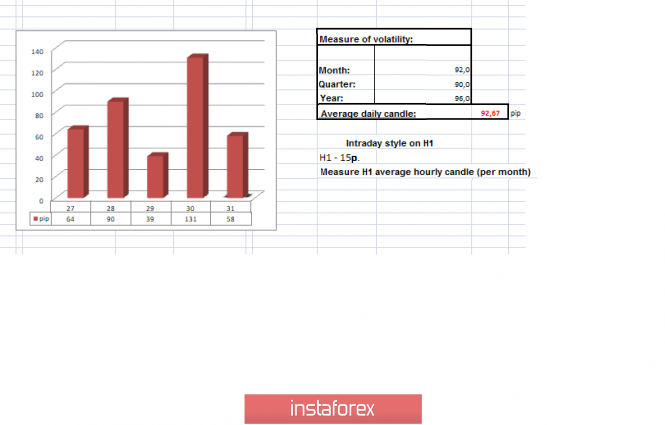
Volatility for the week / Volatility measurement: Month; Quarter; Year
The volatility measurement reflects the average daily fluctuation, based on the calculation for the Month / Quarter / Year.
(January 31 was based on the time of publication of the article)
The current volatility is 58 points, which is not bad for the day after the rally. There is a possibility that if activity slows down, the volatility of the day will be within the daily average.
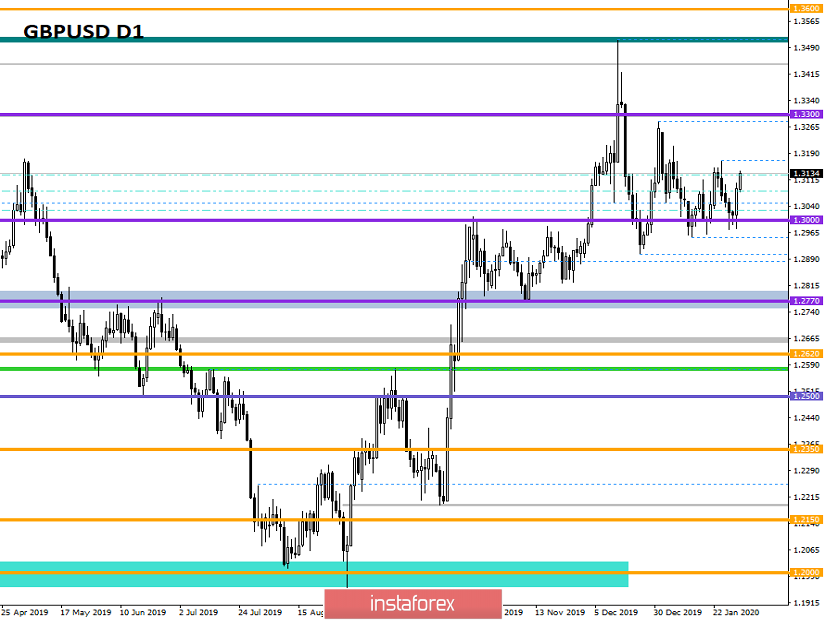
Key level
Resistance zones: 1,3170**; 1,3300**; 1,3600; 1,3850; 1,4000***; 1,4350**.
Support areas: 1,3000; 1,2885*; 1,2770**; 1,2700*; 1,2620; 1,2580*; 1,2500**; 1,2350**; 1,2205(+/- 10p.)*; 1,2150**; 1,2000***; 1,1700; 1,1475**.
* Periodic level
** Range level
***Psychological level
**** The article is based on the principle of conducting a transaction, with daily adjustments.