From the point of view of a comprehensive analysis, we see price fluctuations within historical lows, and now let's talk about the details. The moment came when the quote returned to its base point, it took 197 days and incredibly high slides. In fact, one of the most difficult stages of recovery was the change in the clock component of the medium-term upward trend, which took 77 days [12/16/19-02.03.20], but it took only 6 days for a full recovery. The inertial downward stroke amazes with its stability and also with its size, and so the sellers managed to lower the quote by 1095 points in the shortest possible time. The foundation area became a variable support, where the price worked out the psychological level of 1.2000 with accuracy.
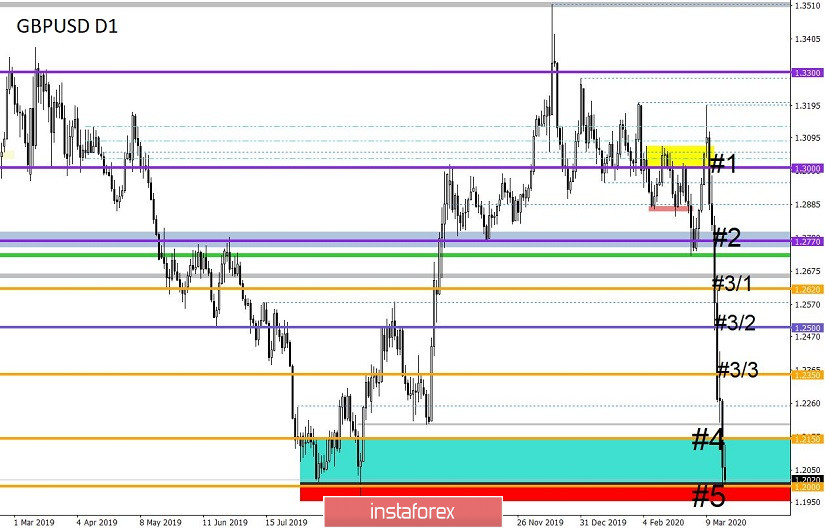
Regarding the theory of downward development, we are successful, since there were signs of a possible change in the medium-term mood at the beginning of the year, where traders were already in short positions. Recovery has gone through all stages # 1 [1,3000]; # 2 [1.2770]; # 3/1 [1.2620]; # 3/2 [1.2500]; # 3/3 [1.2350]; # 4 [1.2150], where the finish line was at least 1.1957, which the price had not yet touched, but already felt on itself. In fact, in the current state of affairs, the 1.1957 / 1.2000 area has become a kind of fifth step, where the global downward trend will officially receive the status of resumed after its breakdown.
In terms of volatility, we record not just an acceleration with respect to daily average indicators, but a kind of panic in the market, where deals are fixed in dollars against all currency instruments. Thus, market activity is inertial.
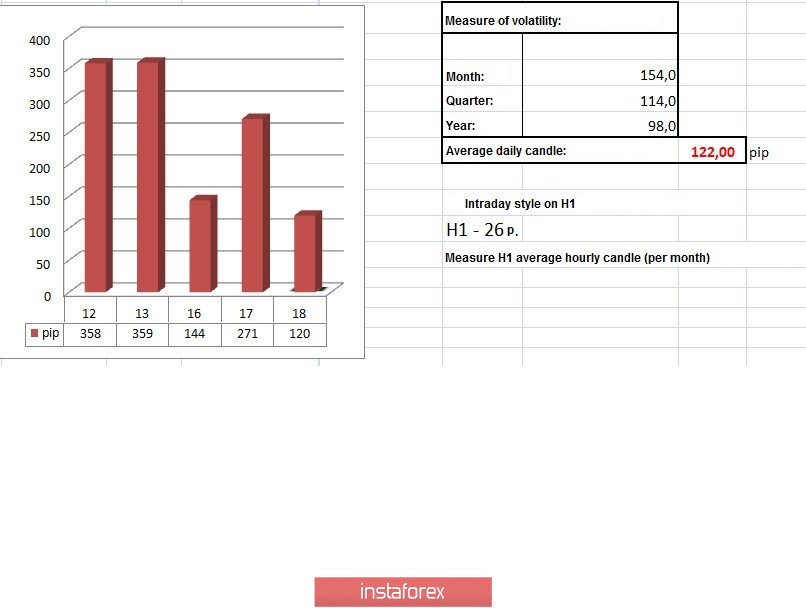
Details of volatility: Monday - 110 points; Tuesday - 102 points; Wednesday - 102 points; Thursday - 107 points; Friday - 103 points; Monday - 165 points; Tuesday - 245 points; Wednesday - 172 points; Thursday - 358 points; Friday - 359 points; Monday - 144 points; Tuesday - 271 points. The average daily indicator, relative to the dynamics of volatility is 122 points [see table of volatility at the end of the article].
Detailing the day by minute, we see that a round of downward movement is set once again with the start of the European session, which lasts until 14:45 [UTC+00 time on the trading terminal]. After that, the area of psychological level 1.2000 is affected and a local pullback is emerging.
As discussed in the previous review, traders worked for the lows, having substantial income. On the other hand, medium-term market participants, whose positions were opened at the beginning of February, made a partial profit taking in the region of 1.2000, considering further work after updating the lows.
Considering the trading chart in general terms [the daily period], we see that the global downward trend, which was set back in 2007, remains the same for the current day.
The news background of the past day contained data on the unemployment rate in Britain, where they forecast a decrease from 3.8% to 3.7%, but as a result, they got an increase to 3.9%. At the same time, published data on the number of applications for unemployment benefits, where instead of increasing applications to 24.0 thousand there was an increase to 17.3 thousand, but this did not help the pound. In the afternoon, the data on retail sales in the United States will be published, where they recorded a slowdown from 5.0% to 4.3%, but forecasted a decrease to 2.7%, thereby not bad indicators.
In terms of the general information background, we have a panic mood and the flight of investors into the American dollar. Coronavirus continues to rage in the world, and negotiations between England and Brussels on trade interactions after Brexit are canceled.
"In light of the recent recommendations regarding coronavirus, we will not formally conduct negotiations on Wednesday in the same format as we did the previous round," a representative of Downing Street said.
Meanwhile, the EU and the UK will exchange drafts of possible options for free trade agreements, as well as other agreements.
"Both sides remain fully committed to the negotiations. We maintain regular contacts with the European Commission in order to consider alternative ways to continue discussions, including the possibility of holding video conferences or telephone conferences," said a representative of the British government.
Today, in terms of the economic calendar, we have macroeconomic data on the construction sector of the United States, where they expect a reduction in the number of issued building permits from 1550 thousand to 1498 thousand, and the number of construction projects that have begun should decrease from 1597 thousand to 1495 thousand. It should be noted that this will not affect the dynamics of the dollar due to panic although the data for the States is not the best.
Further development
Analyzing the current trading chart, we see that the quote seeks to test the level of 1.2000 for strength once again, showing high activity. In fact, the downward interest continues to develop, where overselling is not paid attention, and updating the lows is a matter of time. It is worth considering that the focus now is on the 1.1957 / 1.2000 area, that is, this is our support where the price can come. The further direction will be in terms of the development of a downward trend, as the ex-head of the Bank of England Mark Carney left to us, parity is possible. Naturally, this was said in a slightly different light, but the downward trend will continue to surprise us.
From the point of view of emotional mood, it is difficult for market participants to cope with the wave of emotions that are set against an external background. High activity and clear speculative interest will remain in the market for quite some time.
By detailing the per-minute time section, we see that the initial pullback ended during the Asian session, where the first round of downward positions was set on the terminal at 2:30 UTC+00.
In turn, traders continue to work on the decline, where they already have fixations.
Having a general picture of actions, it can be assumed that a decline towards a minimum of 1.1957 is possible in the near future, after which acceleration in the same direction where the quote will locally go down to the 1.1900 / 1.1850 area is not exempted.
Based on the above information, we derive trading recommendations:
- Buy positions are considered in case of local pullbacks, for shorter time periods.
- Sales positions are already being conducted in the direction of 1.1957, where in the event of a breakdown of the level, prolongation in the direction of 1.1900-1.1850 is possible.
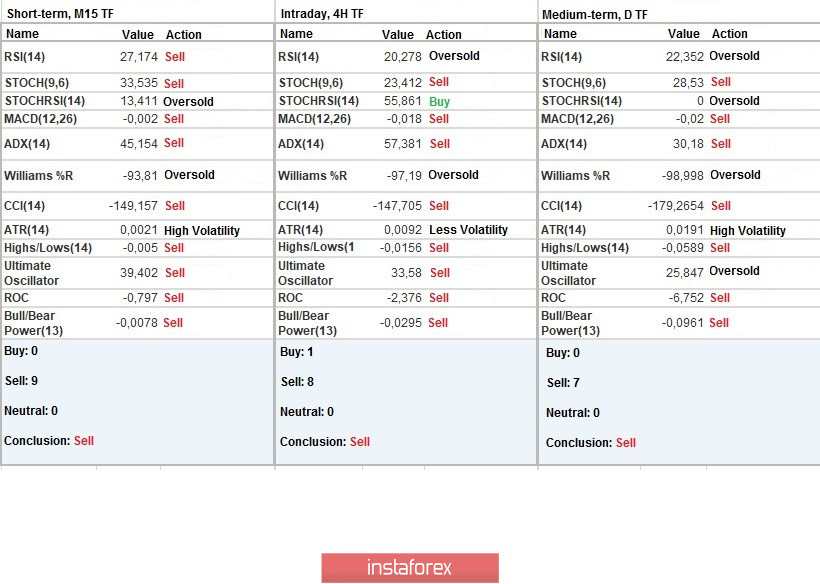
Indicator analysis
Analyzing a different sector of timeframes (TF), we see that the indicators of technical instruments adhere to the downward movement, having a single signal about the sale.
Volatility per week / Measurement of volatility: Month; Quarter; Year
Measurement of volatility reflects the average daily fluctuation, calculated for the Month / Quarter / Year.
(March 18 was built taking into account the time of publication of the article)
The volatility of the current time is 120 points, which is the value of the average daily indicator. It is likely to assume that activity will not end there and we will see the excess of the average value again due to the persisting external background.
Key levels
Resistance zones: 1.2150 **; 1.2350 **; 1.2500; 1.2620; 1.2725 *; 1.2770 **; 1.2885 *; 1.3000; 1.3170 **; 1.3300 **; 1.3600; 1.3850; 1.4000 ***; 1.4350 **.
Support areas 1.2000 *** (1.1957); 1.1850; 1.1700; 1.1475 **.
* Periodic level
** Range Level
*** Psychological level