From the point of view of a comprehensive analysis, you can see the development of the resistance level, with a partial restoration of the price, and now let's talk about the details.
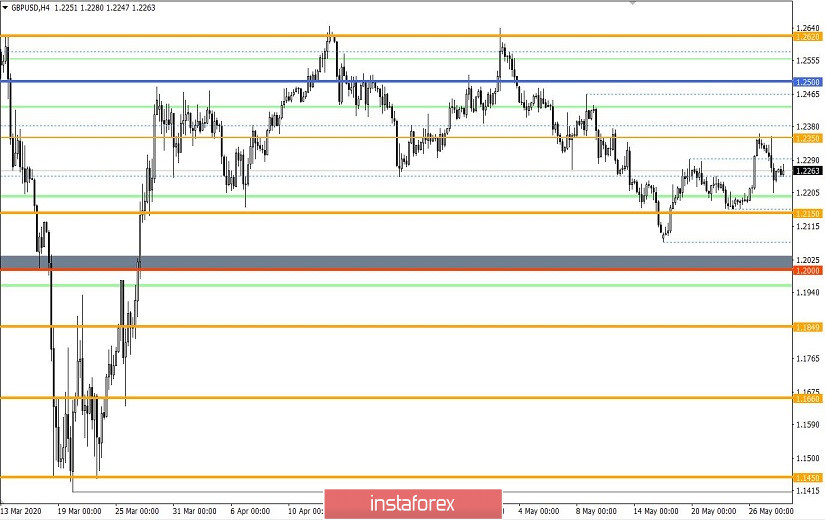
The last trading day continued to delight market participants with high volatility, during which the quote managed to work out the resistance level of 1.2350, having a significant recovery. So the dynamics locally returned the quote to the level of 1.2204, and this is actually the beginning of the impulse jump on May 26. Market participants failed to stay on such an attractive coordinate; an upward pullback arose, possibly due to local overheating of short positions.
The current development of the quote has stirred up discussions regarding the resumption of the flat channel 1.2150 // 1.2350 // 1.2620, which is confirmed by touching the average deviation price. The discussion has its own assumption that the flat could change the width, where the lower part of 1.2150/1.2350 will play the main role in the oscillation.
Regarding the theory of medium-term development, everything is not so simple here. The earlier assumption of a downward movement towards historical lows may temporarily be postponed if the quote reoccurs into a sideways course. In this case, it is necessary to focus the price on the area of 1.2000/1.2150, then the assumption of a downward development will gain a significant part.
Analyzing the past trading day in detail, you can see that the surge in short positions occurred in the period from 11:00-14:00 UTC+00, where the maximum course for the day was crossed. Then there was a pullback, working out about 40% of the downward surge.
In terms of volatility, an acceleration of 12% is recorded relative to the average daily indicator. It is worth recalling that this is the second day with high activity, and before that, we had a conditional accumulation with an average dynamics of 60 points.
As discussed in the previous review, traders were ready for a price rebound from the level of 1.2350, so sales transactions were gradually introduced into the market.
The recommendation from Tuesday regarding the further downward movement from the level of 1.2350 coincided, where we received another profit.
[We consider selling positions lower than 1.2280, with the prospect of a move to 1.2250 and 1.2150 / 1.2180.]
There was literally no news background of the past day if we consider only statistical data, but if you pay attention to the information background, then there is something to see.
So there was a noise about the Brexit trade negotiations once again, where the English side is calling on Europe to reconsider its unwavering position.
"The EU must change its position to reach an agreement. Yes, we think so," said David Frost, British chief negotiator at the Brexit discussion in the British Parliament.
Frost notes that the parties have a lot of disagreements, and the fundamental question for Britain is to be able to establish their own laws.
"At present, we have fundamental disagreements on most aspects of a level playing field," Frost told the parliamentary committee.
Time is running out, the next round of negotiations is scheduled for June 1, and it is largely decisive, since after the extension of the transition period it cannot be in accordance with the current rules. For this reason, British Prime Minister Boris Johnson is planning to personally visit Brussels in the second half of June to resolve issues.
Based on the assumptions of David Frost, during the prime minister's trip, meetings can be held with European Commission President Ursula von der Leyen and European Council President Charles Michel to formally assess the state of negotiations.
Today, in terms of the economic calendar, we are expecting a second estimate of the United States GDP for the first quarter, where the economic downturn may reach -4.8%. In addition, weekly data on applications for unemployment benefits in the United States will be published, where repeated applications will put a new record, and the number of habitual applications may be 2,120,000.
Further development
Analyzing the current trading chart, a slight slowdown in the price within the range of 1.2250 can be seen, which corresponds to the dynamics of stagnation in the period earlier in terms of scope. Now, it's difficult to set medium-term forecasts, as many questions remain, but for local positions, it's time. Thus, analyzing the variable stagnation and knowing the main levels along the way, we can make a forecast about the local price movement.
In terms of the emotional mood of the market, a high coefficient of speculative operations is still recorded, which will positively play on the dynamics of volatility.
We can assume a temporary price fluctuation in the range of 1.2240/1.2295, which will coincide with the dynamics of stagnation in the period earlier. The next step will come from the points of price consolidation outside the established boundaries, having local positions in the direction of the main levels.
Based on the above information, we derive trading recommendations:
- We consider selling positions below 1.2230, with the prospect of a movement to the area of 1.2150/1.2180.
- We consider buying positions above 1.2300, with the prospect of a movement to 1.2350.
Indicator analysis
Analyzing a different sector of time frames (TF), we see that the indicators of technical instruments have a variable signal, where hourly periods signal a sale due to a price rebound from the level of 1.2350. The daily period reflects the general course of prices from May 18, signaling a purchase.
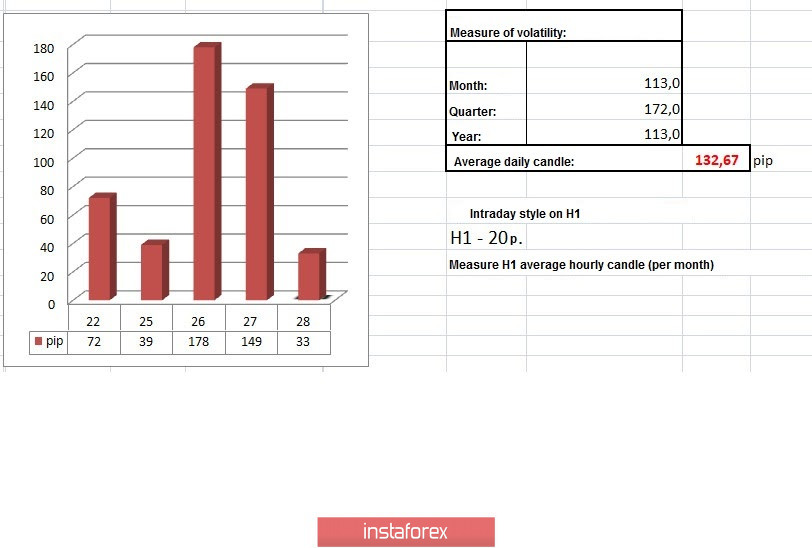
Volatility per week / Measurement of volatility: Month; Quarter; Year
Measurement of volatility reflects the average daily fluctuation, calculated for the Month / Quarter / Year.
(May 28 was built taking into account the time of publication of the article)
The volatility of the current time is 33 points, which is a low value relative to the average daily indicator. It can be assumed that the dynamics set days earlier will continue, and this will involve subsequent acceleration.
Key levels
Resistance zones: 1.2350 **; 1.2500; 1.2620; 1.2725 *; 1.2770 **; 1.2885 *; 1.3000; 1.3170 **; 1.3300 **; 1.3600; 1.3850; 1.4000 ***; 1.4350 **.
Support Areas: 1.2250; 1.2150 **; 1.2000 *** (1.1957); 1.1850; 1.1660; 1.1450 (1.1411); 1.1300; 1.1000; 1.0800; 1.0500; 1.0000.
* Periodic level
** Range Level
*** Psychological level
**** The article is built on the principle of conducting a transaction, with daily adjustment