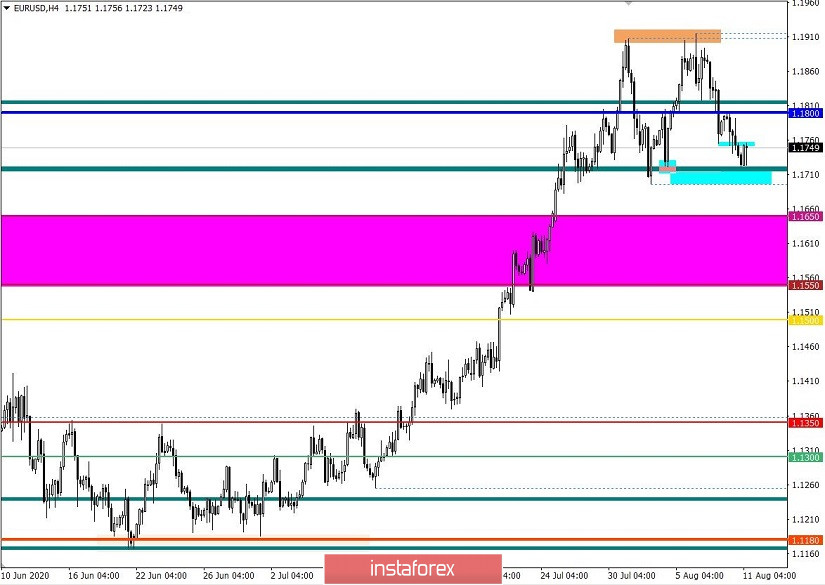
The EUR/USD currency pair, on the wave of the downward movement from last Friday, managed to return to the already familiar from history level of 1.1720, where a slowdown occurred on a natural basis and, as a result, a pullback in the opposite direction.
The inertial movement of the price has been worrying traders for more than a month, but after market participants reached the range of 1.1900/1.1920, an interaction of trade forces arose. Over the past two weeks, there was a change in the structure of the inertial movement, from ascending to lateral, as a result, having a transition to an amplitude of 1.1700/1.1910.
In some sense, this is a success. The sales of the US dollar are gradually coming forward and this is beneficial to the overheated market, where irrational movements were observed on almost all fronts, as happened with the overbought European currency.
Regarding the theories of market development, the topic of the oversold of the US dollar, which we mentioned above, is devoted to a wide discussion of traders. The slowdown in quotes is combined with the "Double Top - H4" chart pattern, which signals a possible market reversal, which, combined with an oversold dollar, as well as an inertial move, may become a promising signal for short positions.
Analyzing the last trading day by the minute, you can see that the downward interest took place throughout the day, the only correction took place in the period 11:30-13:30 UTC+00, but then everything recovered, and the quote updated the daily minimum.
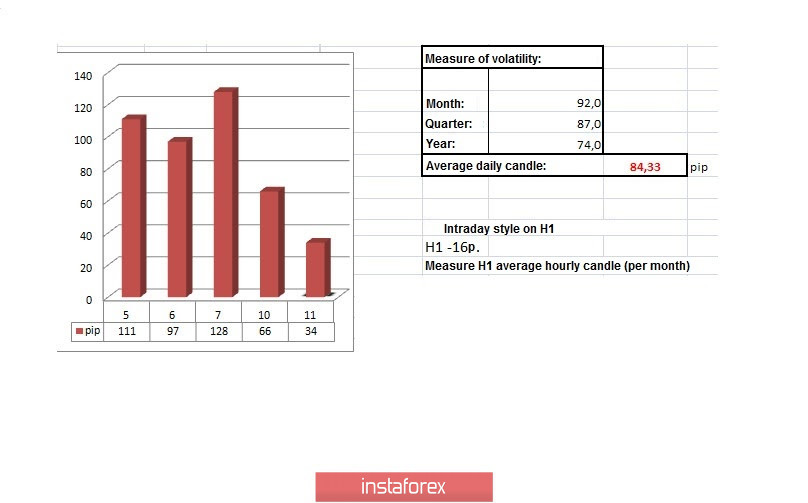
In terms of daily dynamics, the lowest volatility indicator for 15 trading days recorded 66 points, which is 21% lower than the average level of 84 ---> 66. This factor with a local convergence of prices with a conventional pillar of 1.1700 may become a signal for an upcoming acceleration in the market ...
As discussed in the previous review, traders were initially focused on renewing last Friday's low (1.1755), which triggered a build-up of short positions. This signal indicated the prevailing downward interest, which provided an opportunity to cash in on subsequent short positions.
Considering the trading chart in general terms (daily period), it appears that it looks like a change of interests regarding an inertial upward move, but the quote of the European currency is still at a conditional maximum.
The news background of the past day included JOLTS data on the number of open vacancies in the US labor market for June, where the forecast for a reduction from 5,397,000 to 4,900,000 did not match, and instead we saw a rise in vacancies to 5,889,000. This is a positive factor for the United States, and it was almost immediately reflected in the growth of the US dollar during the publication of statistics.
In terms of the information background, we have a comment by the head of the Federal Reserve Bank (FRB) of Minneapolis, Neel Kashkari, for the New York Times. So, the head of the Federal Reserve Bank believes that the "lockdown" regime introduced in March was not tough enough and led to the lag of the United States behind other countries in terms of economic recovery. Kashkari and other heads of the Federal Reserve Bank agree that until the COVID-19 virus is taken under full control, the risks of a worsening situation in the economy should not be ruled out.
Today, in terms of the economic calendar, we have only the producer price index in the United States, where an acceleration of 0.3% in July (m / m) is expected.
Further development
Analyzing the current trading chart, you can see the prevailing downward interest, where the quote has already updated the minimum of the previous day, but now market participants are faced with the main support in the face of the 1.1700 area. In theory, we may well touch the value of 1.1700, but for this it is necessary to fix below the minimum on August 4 - 1.1721, which will give an opportunity to accelerate in the direction of 1.1700.
For drastic changes in the market, the quote must be consolidated below 1.1690 on a four-hour period, which can lead to significant changes in the euro rate, lowering it to values of 1.1650 - 1.1600 - 1.1550.
An alternative scenario considers the price rebound from the area 1.1700/1.1720, thereby repeating the natural basis of the previous period.
Indicator analysis
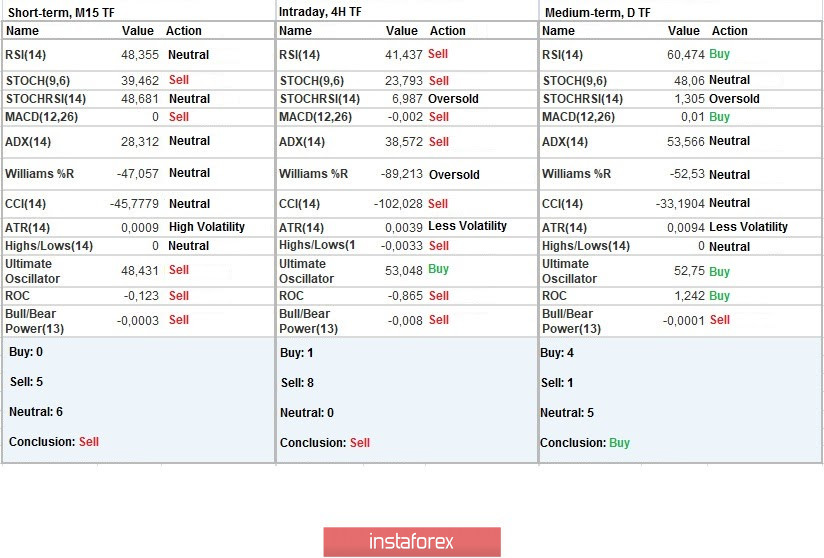
Analyzing different sectors of time frames (TF), we see that indicators of technical instruments on minute and hourly periods signal a sell by focusing the price within the lower border of the range 1.1700/1.1910. The daily period signals a buy, but due to the two-week move transformation, signals of a possible change in the signal from buy to neutral have appeared. This is likely to happen after the price consolidates below 1.1690.
Weekly volatility / Volatility measurement: Month; Quarter; Year
Measurement of volatility reflects the average daily fluctuation, calculated per Month / Quarter / Year.
(11 August was built taking into account the time of publication of the article)
The current volatility is 34 points, which is 59% below the daily average. Now, everything depends on the behavior of speculators, since in case of a breakdown of the level 1.1700, an impressive acceleration may occur.
Key levels
Resistance zones: 1,1800 **; 1.1900 *; 1.2000 ***; 1.2100 *; 1.2450 **.
Support zones: 1.1650 *; 1,1500; 1.1350; 1.1250 *; 1.1.180 **; 1.1080; 1.1000 ***; 1.0850 **; 1.0775 *; 1.0650 (1.0636); 1.0500 ***; 1.0350 **; 1.0000 ***.
* Periodic level
** Range level
*** Psychological level