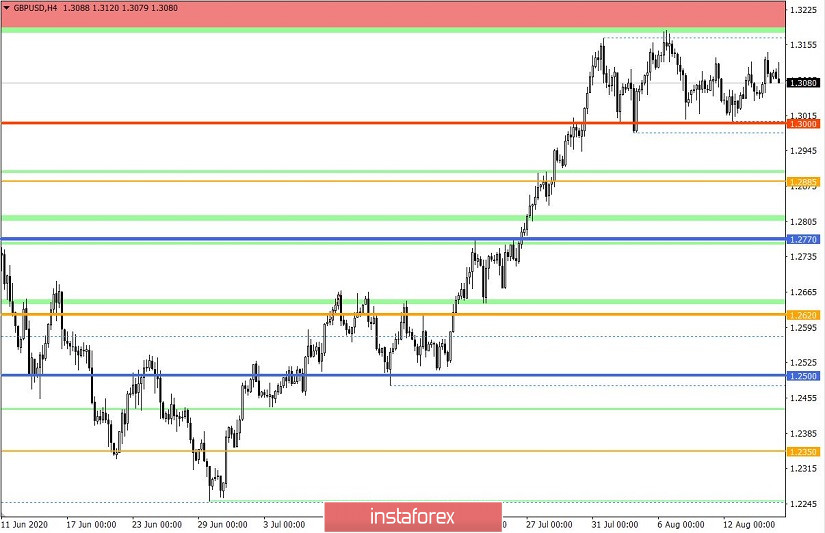
The GBP / USD currency pair ended last week without any drastic changes. As before, the quote follows the course of the sideways channel 1.3000 / 1.3185, showing moderate volatility.
Working within the established framework is a variable task for most traders, as the key strategy has been and will be aimed at breaking the established boundaries. With a probability of almost 100%, we can already say that the current flat is a cumulative platform, where a breakdown of one or another border will lead to a price jump and this is indicated not only by a closed cycle of fluctuations, but also by the type of daily candles. The flat consists of 80% of two-digit Doji daily period candles, which signal the indecision of market participants, as well as their readiness to jump.
Analyzing last Friday's trading by the minute, a round of long positions in the period 9:30 - 13:00 (UTC +00 time by the trading terminal) can be seen, where the quote locally managed to touch the value of 1.3141. After that, there was a reverse surge in activity, which returned the quote to within 1.3080.
In terms of daily volatility, the indicator is fixed below 100 points for five days, which signals a decrease in activity, confirming the fact that market participants are hesitant to act. It should be noted that there is plenty of current activity for a sideways channel and market stagnation.
As discussed in the previous review, the main tactic for most traders is the method of breaking through the established flat boundaries, which will make it possible not only to play on a large surge wave, but also to receive a signal about the direction of the move.
The news background on Friday included data on retail sales in the United States, where according to the report, growth in July to 1.2%, against expectations of 1.9%, which sharply affected the US dollar in terms of its further weakening. On the positive side, it is worth highlighting that the previous data for June was revised for the better - from 7.5% to 8.4%, however, this did not help the dollar in any way.
A little later, the US industrial production data for July was published, where they recorded a 3.4% jump instead of a 3.0% growth, which helped to rectify the situation. Thus, the dollar entered a strengthening phase, regaining lost positions at the time of weak retail sales data.
Today, in terms of the economic calendar, we have interesting statistics for the UK and the US. The market will continue to follow the technical fluctuation.
Further development
Analyzing the current trading chart, you can see the movement of the quote at the levels of the last week, which indicates low activity in terms of price changes. Flat formation of 1.3000 / 1.3185 can serve for trading within the established boundaries, but the risk of falling into a low-amplitude swing is high, and this can lead to illiquid transactions. The main strategy that should be followed is the method of breaking through the established boundaries of 1.3000 / 1.3185, which will make it possible not only to ride on an impulse price jump, but to understand in which direction the market will continue to develop in the future.
Based on the above information, we will display trading recommendations:
- Consider buy positions above 1.3185, towards 1.3250.
- Consider sell positions below 1.2985, towards 1.2885-1.2770.
Indicator analysis
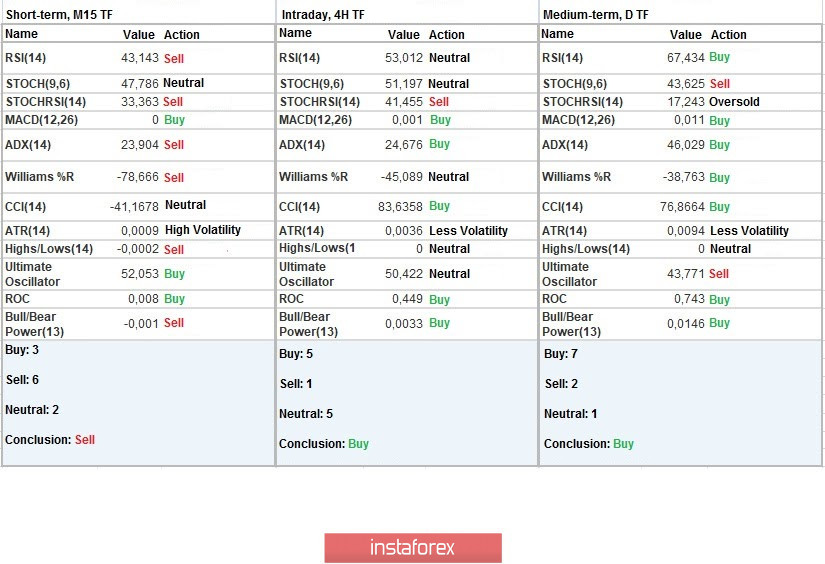
Analyzing different sectors of time frames (TF), we see that the indicators of technical instruments on minute and hourly intervals work on the basis of the price movement in the established channel, that is, depending on which half of the flat the quote is in ... The daily period has been signaling a buy for several weeks in a row, reflecting the general direction.
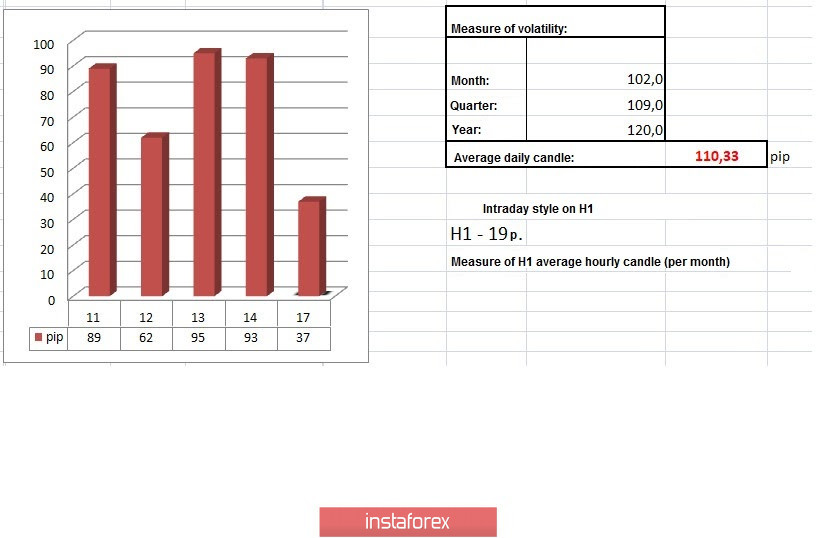
Weekly volatility / Volatility measurement: Month; Quarter; Year
The volatility measurement reflects the average daily fluctuations, calculated per Month / Quarter / Year.
(August 17 was built taking into account the time of publication of the article)
The volatility of the current time is 37 points, which is 66% below the daily average. It is very low, so speculation may arise in the near future, accelerating us by 50-100% relative to the current volatility value.
Key levels
Resistance zones: 1.3200 (1.3250) **; 1.3300 **; 1.3600; 1.3850; 1.4000 ***; 1.4350 **.
Support zones: 1.3000; 1.2885 *; 1.2770 **; 1.2620; 1.2500; 1.2350 **; 1.2250; 1.2150 **; 1.2000 *** (1.1957); 1.1850; 1.1660; 1.1450 (1.1411); 1.1300; 1.1000; 1.0800; 1.0500; 1.0000.
* Periodic level
** Range level
*** Psychological level