EUR/USD 5M
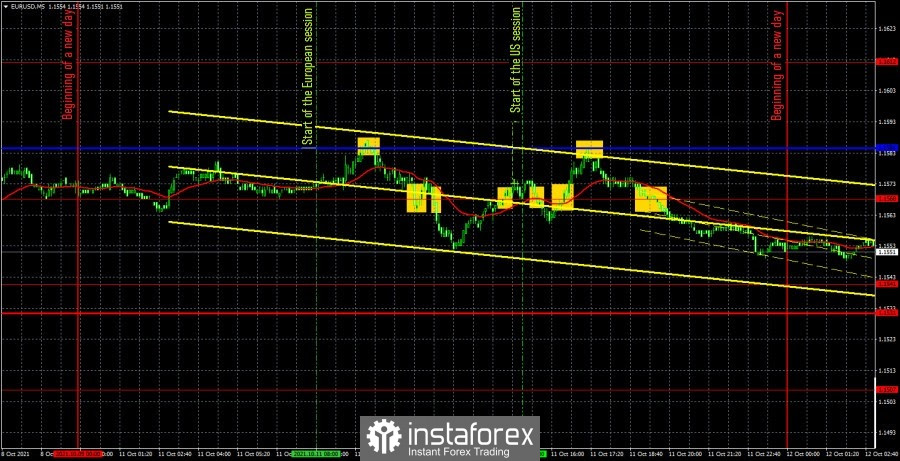
The EUR/USD pair continued to pursue only one goal during the first trading day of the week - setting a new volatility anti-record. Last week, we recall, there was even a time when the pair passed 25 points in a day. It passed 35 points on Monday. As we have already said many times, low volatility and the absence of a clear trend movement during the day are the main enemies of traders for any pair or instrument. And with low volatility, you can hardly count on a trend movement. On the 5-minute timeframe, you can clearly see that the pair had been in a horizontal channel for the entire day and at the same time, it was forming trading signals in "packs". Thus, most of these trading signals naturally turned out to be false. There were no macroeconomic reports or fundamental events on the first day of the week. Traders had nothing to react to, but even when there was something, they were in no hurry to do it (NonFarm Payrolls report last Friday). Let's move on to trading signals and see how you should trade. The first signal in the form of a rebound from the Kijun-sen critical line was almost perfect in terms of accuracy. However, only 5 points were earned on it, because the price bounced off the nearest level of 1.1568. And it overcame it after 15 minutes. Thus, two false signals were formed near this extreme level at once. The first to buy, closed at a loss of 12 points. The second one is for selling, it closed at a loss of 10 points. After that, we should not have considered a single trading signal near the level of 1.1568. However, in the end, the pair still presented a surprise to traders in the form of another strong sell signal from the Kijun-sen line. This time the price crossed the 1.1568 level without any problems and the short position should have been manually closed in the late afternoon with a profit of about 15 points. Thus, in total traders did not receive either profit or loss today.
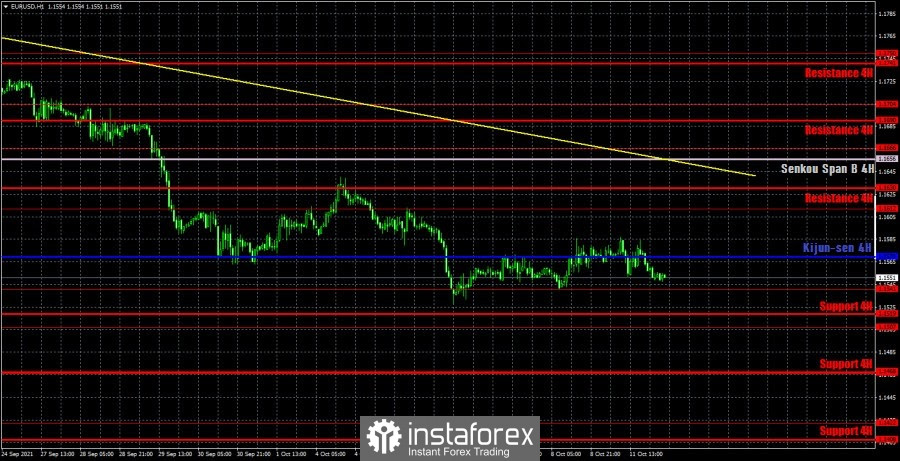
EUR/USD 1H

You can see that the euro/dollar pair continues to try to correct to the downward trend line on the hourly timeframe. At the same time, the downward trend persists, and, by and large, there is no movement. Volatility at this time is low, and the price cannot even really correct. We highlight the following levels for trading on Tuesday - 1.1507, 1.1541, 1.1612, 1.1666, as well as the Senkou Span B (1.1656) and Kijun-sen (1.1570) lines. The Ichimoku indicator lines can change their position during the day, which should be taken into account when looking for trading signals. Signals can be rebounds or breakthroughs of these levels and lines. Do not forget about placing a Stop Loss order at breakeven if the price moves 15 points in the right direction. This will protect you against possible losses if the signal turns out to be false. Nothing interesting will happen in either the United States or the European Union on October 12. The only more or less (rather, less) important report of the day will be the ZEW Business Sentiment Index for the European Union. However, this report, if it evokes a reaction from the markets, is once a year, not more often. Thus, it looks like we are waiting for another day with low volatility and, possibly, an outright flat.
We also recommend that you familiarize yourself with the forecast and trading signals for the GBP/USD pair.
COT report
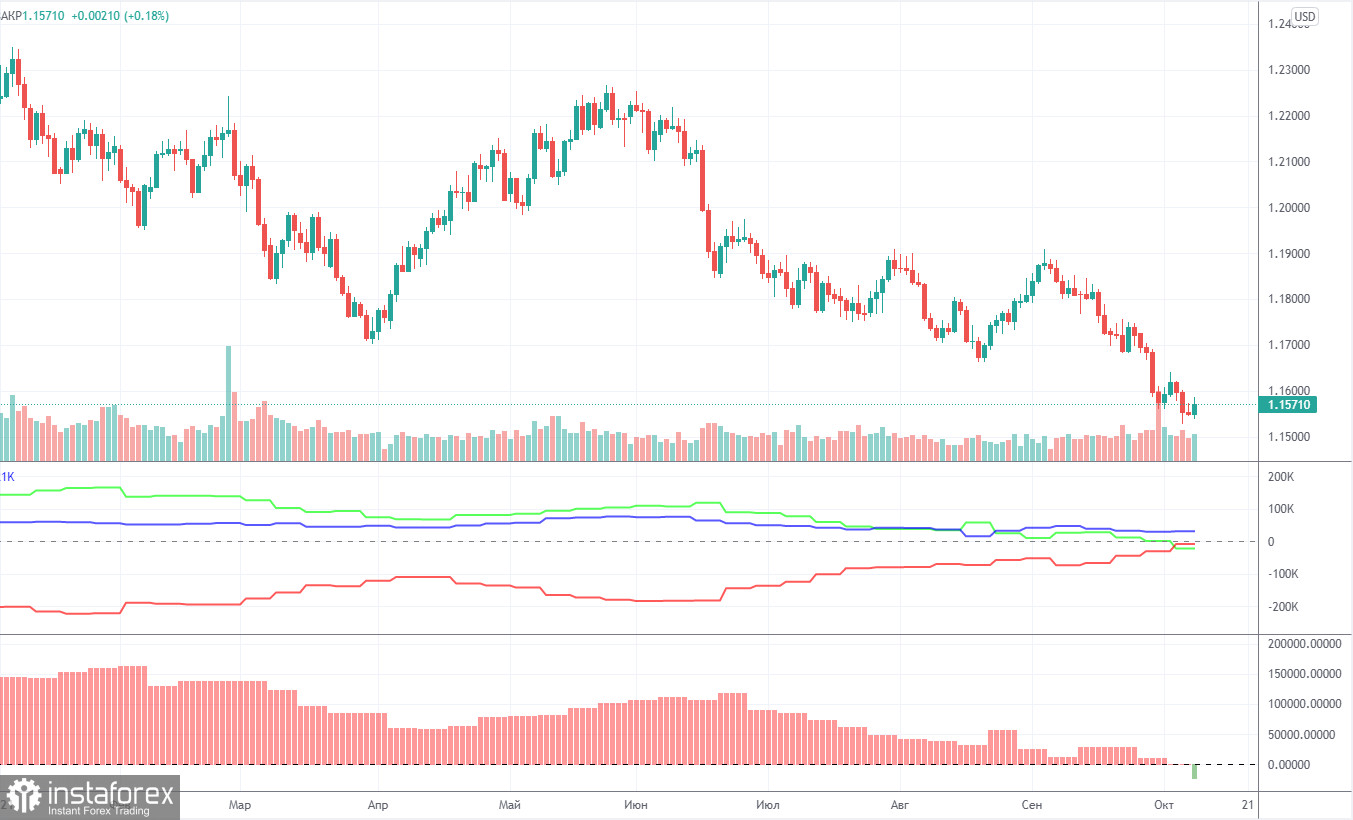
The mood of non-commercial traders became fully bearish during the last reporting week (September 28 - October 4). If a week earlier the number of buy and sell contracts for major players practically coincided, then after the next Commitment of Traders (COT) report the balance of forces changed in favor of the bears. During the reporting week, professional traders opened 26,000 sell contracts (shorts) and only 2.5 thousand buy contracts (longs) of the euro. Thus, the net position of the "non-commercial" group decreased immediately by 23,500, which is a lot even for the euro. At the same time, the total number of buy contracts became less than the number of sell contracts. Now the first 198,000 ones are open for large players, and the second - 220,000. So now it is already possible to announce that the mood for the euro currency has formed bearish, which significantly increases the likelihood of a further fall in the EU currency. The first indicator in the chart above, which displays the change in net positions of all groups of traders, clearly shows that the green line has gone below zero, and the red line is about to cross it from the bottom up. Thus, traders can immediately receive a double signal for a further fall in the euro. First, the red and green lines will intersect, which indicates a change in mood. Secondly, both of these lines will cross the zero mark, which indicates the same thing. In general, based on the COT reports, the likelihood of a further fall in the euro is growing. Technique is now saying the same thing.
Explanations for the chart:
Support and Resistance Levels are the levels that serve as targets when buying or selling the pair. You can place Take Profit near these levels.
Kijun-sen and Senkou Span B lines are lines of the Ichimoku indicator transferred to the hourly timeframe from the 4-hour one.
Support and resistance areas are areas from which the price has repeatedly rebounded off.
Yellow lines are trend lines, trend channels and any other technical patterns.
Indicator 1 on the COT charts is the size of the net position of each category of traders.
Indicator 2 on the COT charts is the size of the net position for the non-commercial group.