Bitcoin halted its growth, failing to break through the $64,000 level. Despite this decline, the cryptocurrency is moving in the range of $62,000-64,000, which indicates a strong bullish sentiment. However, after analyzing the price movement during the day, there has been a strong resistance level. Bulls are unable to push bitcoin above this level now. The increased pressure on the BTC quotes could lead to a complication of upward movement. To access how accurate this scenario may be and to determine the strength of the bullish trend, it is necessary to look at the technical indicators of the crypto asset.
Judging by on-chain activity, a possible reason for the BTC slowdown could be that the fact that long-term investors are flocking back to the market. They have kept coins for longer than 150 days. Yesterday, BTC successfully broke through the $60,000 level. Thus, 99% of the coins in circulation managed to gain. Many investors decided to lock in profits in order to secure their investments, which put pressure on the BTC price. Naturally, long-term investors who opened long positions on BTC earlier above the $40,000 were the first to close them. Their returns are now much bigger than that of medium- and short-term traders who have purchased bitcoin above $40,000-50,000. As traders have begun to get rid of assets, having received the profit on speculation, the pressure on quotes will increase. It may slow upward. To understand how the sell-off of coins affected the uptrend, it is necessary to analyze technical indicators.
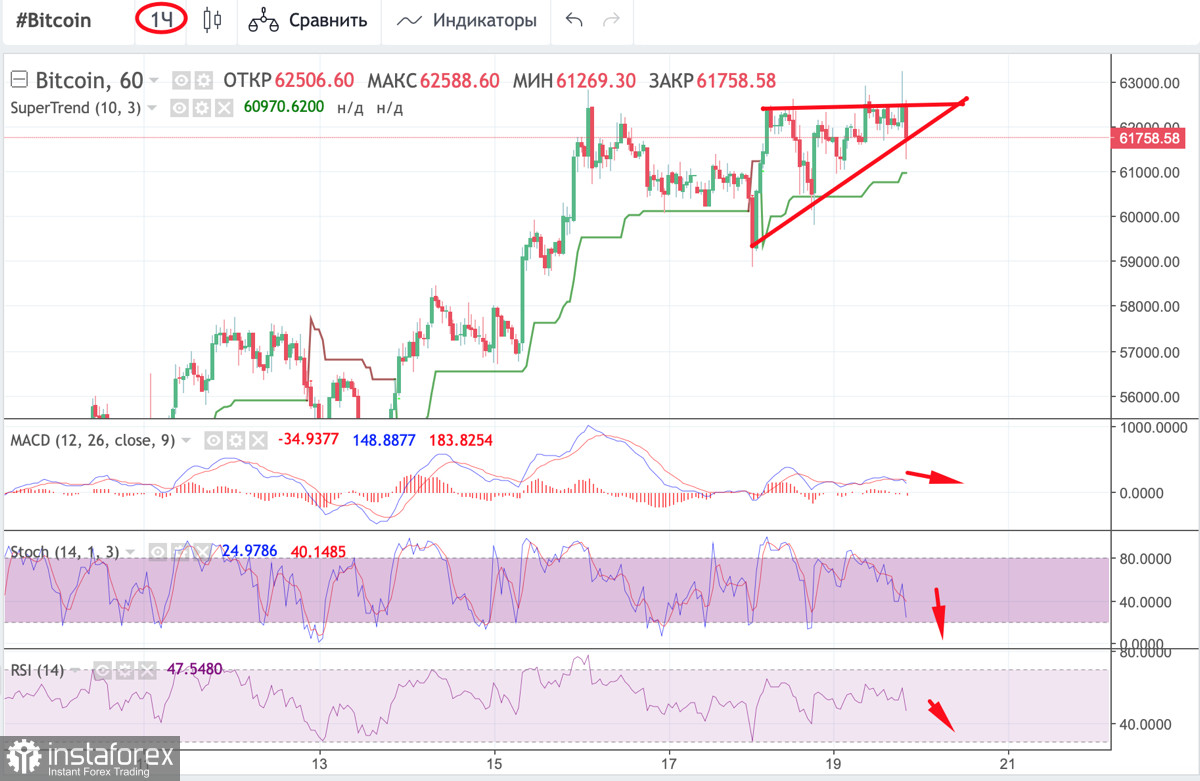
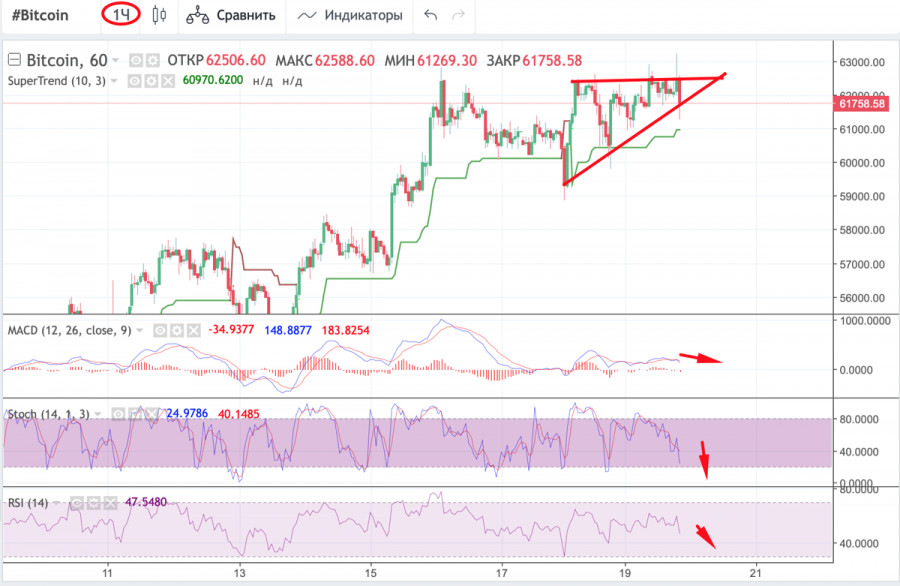
On the 1H chart, bitcoin looks very weak and may fall behind the super trend line. The selling pressure is getting stronger and the technical indicators are starting to decline sharply. The MACD indicator has formed a bearish intersection, which signals the weakening of the uptrend and a gradual decline in the price and volume of purchases. The stochastic oscillator and the RSI indicators also dropped. It indicates a sell-off and the absence of large investors. In addition, a breakout of the bullish triangle may occur soon, pushing BTC even lower. To sum up, the sell-off has had a negative impact on the BTC growth of. For this reason, it slipped into a narrow range. To confirm the downward trend, it is necessary to access larger timeframes.
The RSI indicator is a technical indicator that helps traders to determine the strength of a trend (descending or ascending) and foresee possible changes in the price movement. By using this indicator, traders may determine at what level an asset may enter an overbought or oversold zone. If the indicator is located at the level of 60, it signals a bullish trend, high demand for the coin, and the strength of the current upward momentum. If the indicator is located below this level, BTC begins to move to the overbought zone.
MACD (index of convergence/divergence of moving averages) is an indicator that helps traders discern the trend based on the movement of moving averages and values between them. The bullish signal is the intersection of the white line under the red and bearish. On the contrary, when the white line from above crosses the red line, it indicates a downward movement.
Stochastic (stochastic oscillator) indicates the strength of the momentum of the current prevailing trend. If the indicator is above the 80 level, then the asset can be considered overbought. If the stochastic is below 20, then the asset is in the oversold zone.
The super trend line is a technical indicator reflecting a bullish (green - a buy signal) and bearish (red - a sell signal) trend on the horizontal charts.
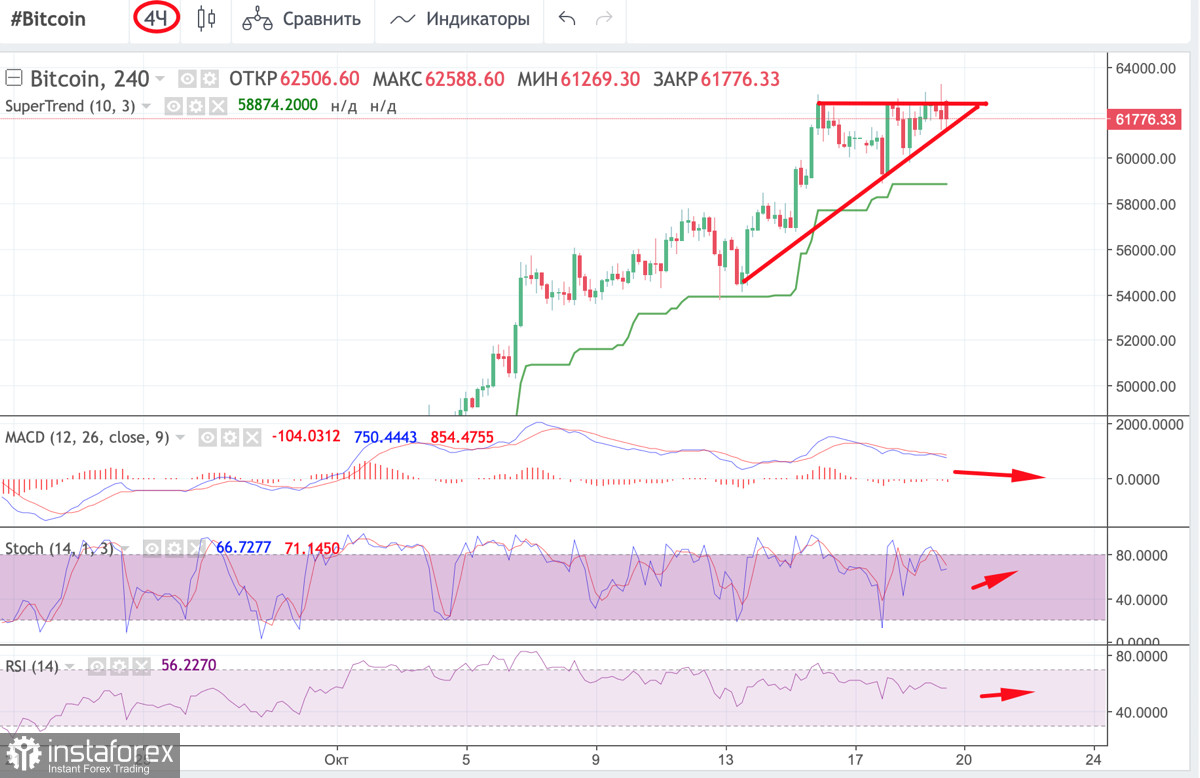
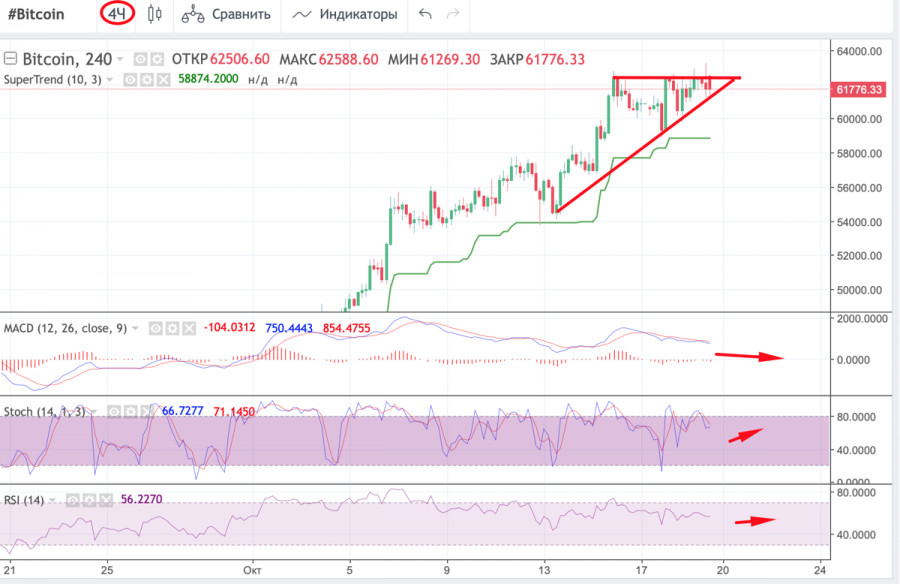
On the 4H chart, the BTC price is stabilizing. However, it is still facing selling pressure due to a large number of red candlesticks. The MACD indicator has started moving sideways after a decline. Stochastic formed a bullish intersection and began to grow. So, traders have resumed purchases. The RSI indicator also gives a buy signal. Both indicators have started moving to the 60 level. Bulls are trying to take the upper hand after a short decline. However, in order to confirm the strength of the bullish momentum, it is necessary to look at the daily timeframe.
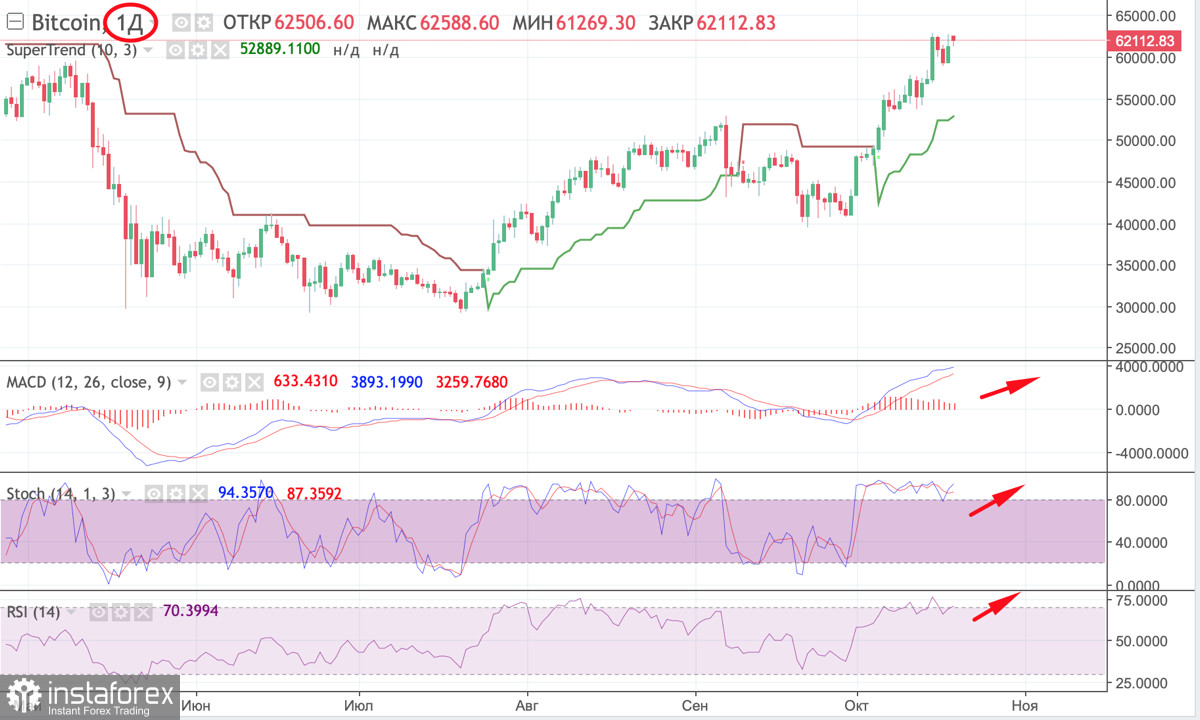
There are no signs of a decline on the daily chart. The bullish momentum is strong enough. So, BTC is likely to recoup its losses in the short term. This is confirmed by the bullish candlestick formed on October 18, as well as by technical indicators. The MACD indicator continues to show an upward momentum after a bullish intersection. The stochastic and RSI indicators are moving above the 70 mark, which indicates the strength of buyers. Overall, the outlook for BTC remains bullish. However, the closer the price is moving to a historical high, the more often investors will lock into profits. Currently, this trend is visible only on small time frames. Yet, the situation may worsen as bitcoin keeps growing.