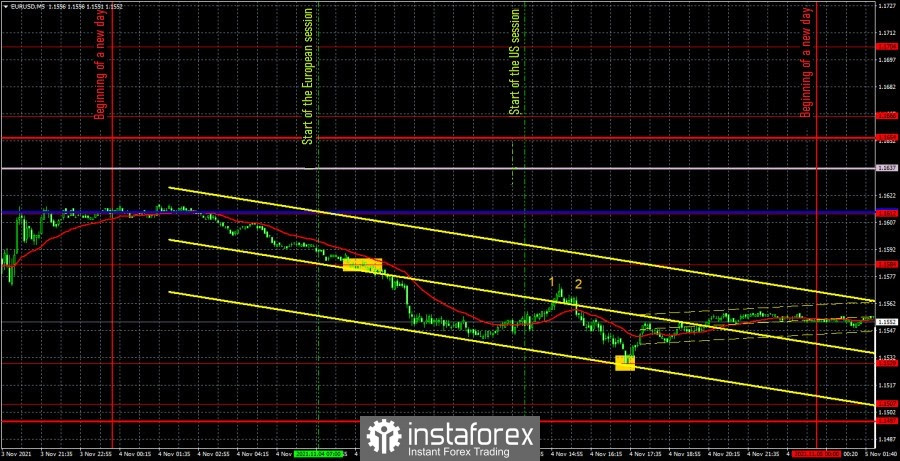
EUR/USD 5M

The EUR/USD pair showed quite good volatility during the penultimate trading day of the week, equal to 90 points. A certain part of this movement fell on night trading, but this is already a trifle. The main thing is that the pair showed good and strong movement, which happens quite rarely with it. As we said in yesterday's review, it may take a whole day for the markets to fully work out such an important event as the Federal Reserve meeting. And so it happened. Just the day before yesterday evening, the movements were not so strong and certainly not tradable, as the pair just jumped up and down for several hours. These movements were impossible to work out, and there was no need to. Yesterday, during the day, there were two more or less important events. The number "1" in the chart indicates the time of publication of the report on claims for unemployment benefits in the United States, and the number "2" - the beginning of European Central Bank President Christine Lagarde's speech. As you can see, after the second event, the fall in the euro currency resumed. Although this could be a coincidence, since before it, the euro currency also fell predominantly. However, we are not very interested in all this. Interestingly, two ideal trading signals were formed during the day, which should have been worked out. Let's see how you should have traded yesterday. The first sell signal was formed when the price settled below the level of 1.1584. At this point, traders should have taken short positions. Subsequently, the price dropped to the level of 1.1529, from which it just rebounded perfectly. Therefore, it was necessary to close short positions (profit was 43 points) here and open long positions. We also managed to earn about 10 points on a long position - it should have been closed manually in the late afternoon. Thus, two trades and a profit of more than 50 points.
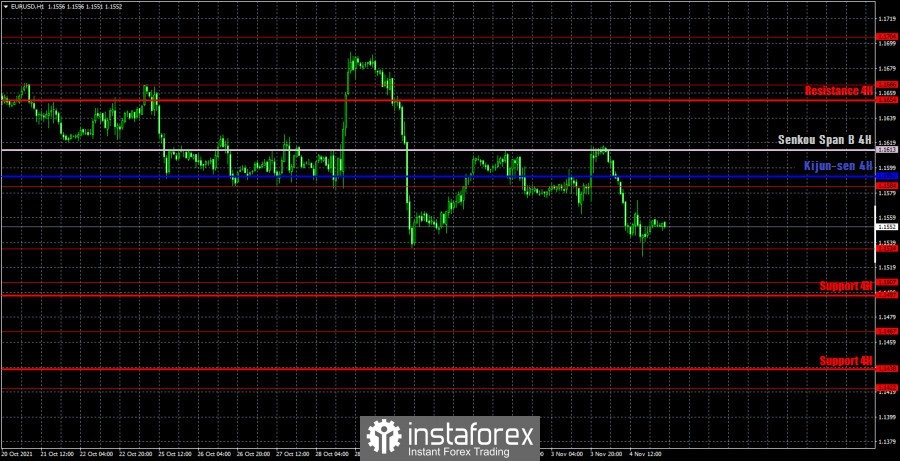
EUR/USD 1H

The trend is still absent on the hourly timeframe, and the price dropped to its previous local low and bounced off it. Thus, the price continues to remain within the 1.1534-1.1666 range, which is better seen on higher timeframes. Therefore, now it is still impossible to form either a trend line or a channel, but at the same time there is no sideways movement as such (there is no horizontal channel either). The movement of the pair remains as confusing as possible, but it still turns out to be profitable. On Friday, we highlight the following levels for trading - 1.1467, 1.1507, 1.1534, 1.1584, 1.1666, as well as the Senkou Span B (1.1592) and Kijun-sen (1.1613) lines. The Ichimoku indicator lines can change their position during the day, which should be taken into account when looking for trading signals. Signals can be rebounds or breakthroughs of these levels and lines. Do not forget about placing a Stop Loss order at breakeven if the price moves 15 points in the right direction. This will protect you against possible losses if the signal turns out to be false. There will be practically no important events in the European Union on November 5. But the United States will publish its October NonFarm Payrolls, unemployment rate and changes in wages. The last two reports are secondary, although also very important. But the Nonfarm report is the icing on the cake this week. We believe that the volatility may be very high tomorrow, and traders will be able to understand whether the Fed did the right thing by starting to roll back the quantitative stimulus program.
We recommend you to familiarize yourself:
Overview of the EUR/USD pair. November 4. Macroeconomic statistics and Christine Lagarde's speech.
Overview of the GBP/USD pair. November 4. Ahead of the Bank of England meeting.
Forecast and trading signals for GBP/USD for November 4. Detailed analysis of the movement of the pair and trade deals.
Analysis of the COT report
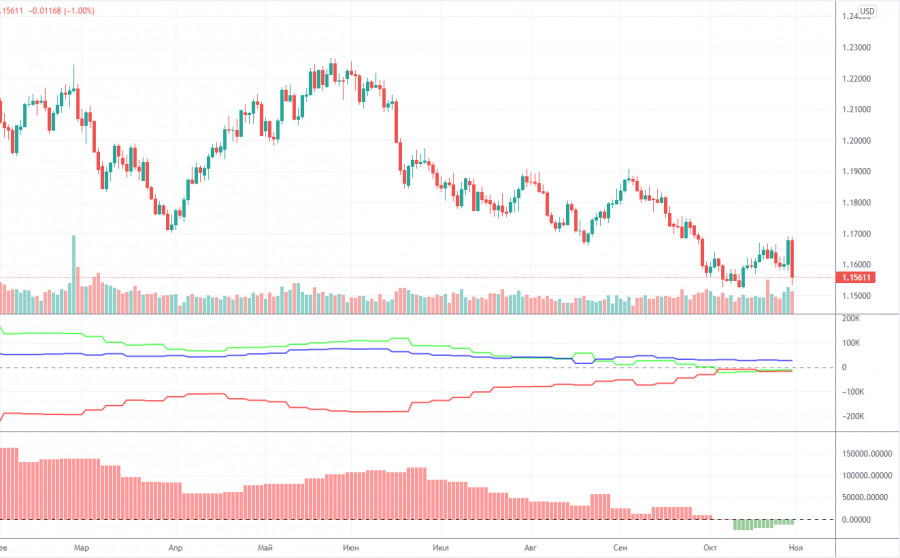
The mood of non-commercial traders practically did not change during the last reporting week (October 19-25). A group of non-commercial traders opened 4,000 sell contracts (shorts) and 4,000 buy contracts (longs). Consequently, the net position of professional players has not changed. And if so, then the mood of the large traders remained... bearish. Yes, exactly bearish, as evidenced by both indicators in the chart above. The green and red lines of the first (net positions of non-commercial and commercial players) continue to move towards each other, which still means that the upward trend is ending. Or the downward correction is delayed. Recall that the process of convergence of these lines began at the beginning of the year, when the upward movement stopped. At this time, this whole process does not even fit into a chart - the downward movement continues for so long, which we still consider to be a correction. The most interesting thing is that the last two trading days this week did not make it into the latest COT report. That is, we do not know how the major players traded on Thursday and Friday, when the pair passed about 250 points. It should also be noted that the net position of non-commercial traders remains below zero. That is, the number of short positions exceeds the total number of long positions. Consequently, based on the COT reports, the fall of the European currency may continue. The nearest target, as we have already said, is the important level of 1.1490. So far, the COT reports absolutely do not provide a conclusion about a change in trend.
Explanations for the chart:
Support and Resistance Levels are the levels that serve as targets when buying or selling the pair. You can place Take Profit near these levels.
Kijun-sen and Senkou Span B lines are lines of the Ichimoku indicator transferred to the hourly timeframe from the 4-hour one.
Support and resistance areas are areas from which the price has repeatedly rebounded off.
Yellow lines are trend lines, trend channels and any other technical patterns.
Indicator 1 on the COT charts is the size of the net position of each category of traders.
Indicator 2 on the COT charts is the size of the net position for the non-commercial group.