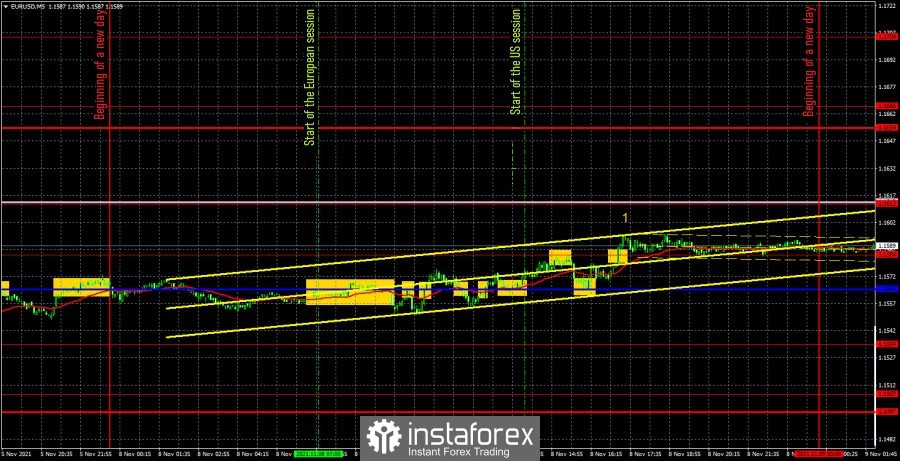
EUR/USD 5M

The EUR/USD pair, as expected, showed a low volatility of 43 points during the first trading day of the week. There is nothing surprising in this, yesterday we said that nothing interesting in macroeconomic terms is planned either in the European Union or in the United States for Monday. However, the situation changed on the one hand, but remained the same on the other. It changed because the speech of Federal Reserve Chairman Jerome Powell was included in the calendar of events. It remained the same – because this speech did not provide any new information and did not affect the course of trading in any way (the figure "1" in the chart). But the movement itself during the day was just disgusting. Not only was the volatility "at zero", but there was also no trend movement, which is why a huge number of trading signals were formed, and all false. Nevertheless, let's still try to figure out how to trade on Monday. The first two signals were for shorts. At first, the price settled below the critical line, and then bounced off it. Every time it went down 3 points and that says it all. Naturally, these signals resulted in a loss of 15 points when the price settled above the Kijun-sen line. The buy signals were no better. After the first of them, the price went up the same 3 points, and the long position closed at a loss of 11 points. All other signals near the Kijun-sen line should have been ignored. It would be possible to try to work out a sell signal in the form of a rebound from the level of 1.1584, which was formed at the beginning of the US session, but at the time of the formation of this signal, the price has almost reached the critical line. The next buy signal near the level of 1.1584 was published exactly during the beginning of Powell's speech... In general, these signals should also be ignored.
EUR/USD 1H
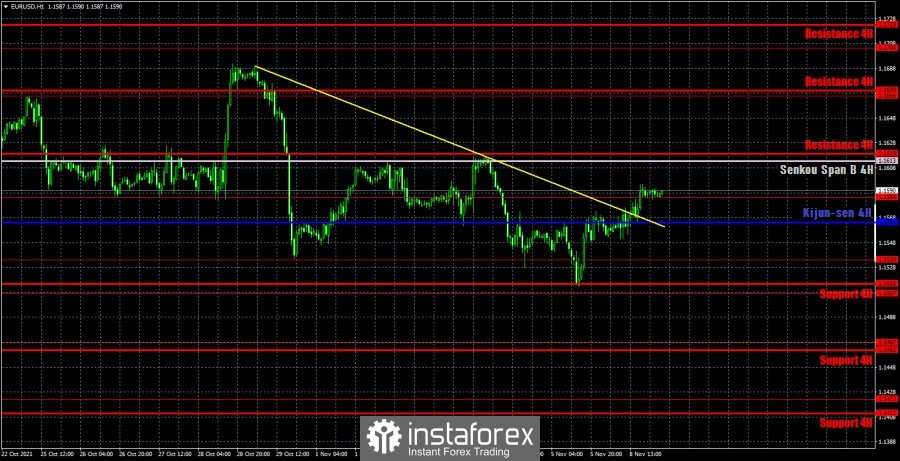
The downward trend quickly formed and immediately reversed on the hourly timeframe. As we have already said many times, the movements for the euro/dollar pair are extremely confusing. They cannot be called either trendy or flat. Now the price has settled above the trend line, tomorrow it can calmly resume the downward movement, but at the same time it will not go below the level of 1.1534 again. We highlight the following levels for trading on Tuesday - 1.1507, 1.1534, 1.1584, 1.1666, as well as the Senkou Span B (1.1613) and Kijun-sen (1.1564) lines. The Ichimoku indicator lines can change their position during the day, which should be taken into account when looking for trading signals. Signals can be rebounds or breakthroughs of these levels and lines. Do not forget about placing a Stop Loss order at breakeven if the price moves 15 points in the right direction. This will protect you against possible losses if the signal turns out to be false. European Central Bank President Christine Lagarde and Powell will speak in the European Union and the United States. We do not believe that these speeches will give anything new to traders, therefore, most likely, they will be ignored. The only thing to do is just be as careful as possible when the officials speak.
We recommend you to familiarize yourself:
Overview of the EUR/USD pair. November 9. The dollar is trying to continue growing, but this is not beneficial to the Fed
Overview of the GBP/USD pair. November 9. The Bank of England may support the pound, while it may rise by 500 points
Forecast and trading signals for GBP/USD for November 9. Detailed analysis of the movement of the pair and trade deals.
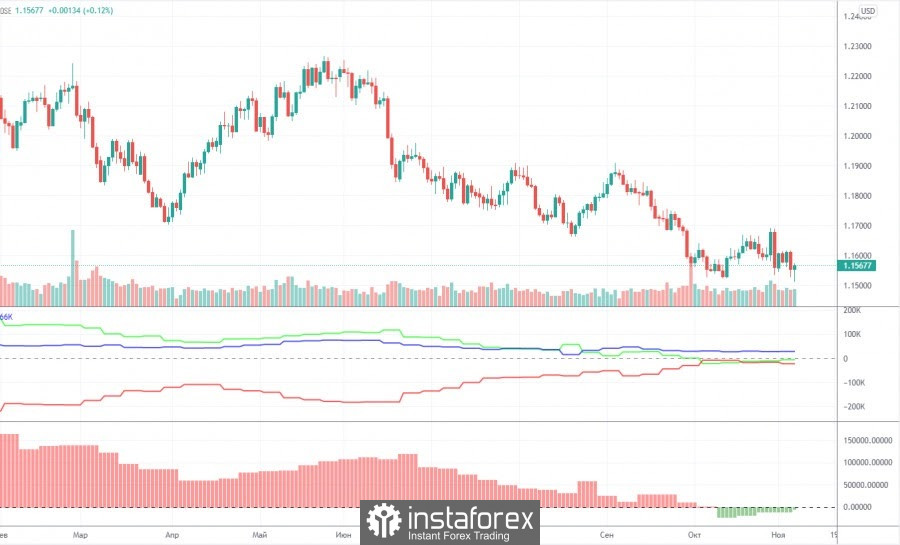
Analysis of the COT report

The mood of non-commercial traders changed, but not much, during the last reporting week (October 26-November 1). A group of "non-commercial" traders closed 4,000 buy contracts (longs) and 10.5 thousand sell contracts (shorts) during the reporting week. Consequently, the net position of professional players has grown by 6.5 thousand, which is not so much. However, the changes in the mood of non-commercial traders are best seen by the first indicator in the chart above. The red and green lines have been moving towards each other for a long time, and in the last couple of months they have been almost at the same level. This suggests that the previous trend is ending, and the mood of the major players at this time is as neutral as possible. This is confirmed by the data on the total number of contracts. The non-commercial group has 195,000 buy contracts (longs) and 199,000 sell contracts (shorts). The commercial group has 418,000 buy contracts and 442,000 sell contracts. That is, as we can see, the numbers are almost the same. Therefore, there are theoretical chances for the continuation of the downward movement in the pair. The trend began to end (an upward trend) when the red and green lines (net positions of the commercial and non-commercial groups) began to narrow. That is, for quite a long time. And now, logically, the downward trend continues. However, this "trend" is still not too similar to the trend. Rather, a banal three-wave correction.
Explanations for the chart:
Support and Resistance Levels are the levels that serve as targets when buying or selling the pair. You can place Take Profit near these levels.
Kijun-sen and Senkou Span B lines are lines of the Ichimoku indicator transferred to the hourly timeframe from the 4-hour one.
Support and resistance areas are areas from which the price has repeatedly rebounded off.
Yellow lines are trend lines, trend channels and any other technical patterns.
Indicator 1 on the COT charts is the size of the net position of each category of traders.
Indicator 2 on the COT charts is the size of the net position for the non-commercial group.