EUR/USD 5M
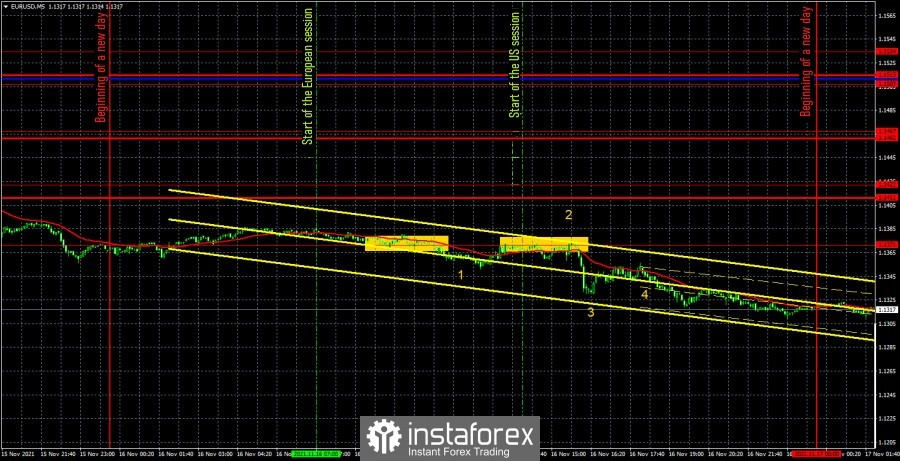
The EUR/USD pair continued to move in a mode close to flat on Tuesday, but again with a decline. Pay attention to the nature of the movement on Tuesday! The pair was between the levels of 1.1351 and 1.1382 throughout the European trading session and the beginning of the US. The pair traded between the same levels during the Asian trading session. What is this if not flat? However, at some point in the second half of the day, a rather strong fall began and within 20 minutes the pair lost 45 points. This time, however, the movement of the pair was at least associated with macroeconomic reports. As we said yesterday, the markets reacted only to the report on retail sales in the US, which turned out to be stronger than forecasted (the number "2" in the chart). But the report on the GDP of the eurozone (number "1"), the report on industrial production in the United States (number "3") and the speech of European Central Bank President Christine Lagarde (number "4") were ignored, which is clearly seen in the chart. Thus, during the previous day, there were and were not movements. Now let's analyze trading signals and understand what could have been done in terms of opening positions. There were only two trading signals on Tuesday. And both are not the most accurate and precise. First, the pair broke through the extremum level of 1.1371, which served as a signal to open short positions. Then the price bounced off the same level of 1.1371, which was another sell signal, but since the short positions were already open, they just had to stay in them. During the first decline, the price did not go down 15 points, so the Stop Loss order was not placed at breakeven. Since there is not a single level from below, around which it would be possible to take profit, the deal should have been manually closed in the late afternoon. The profit on it was 18 points.
EUR/USD 1H
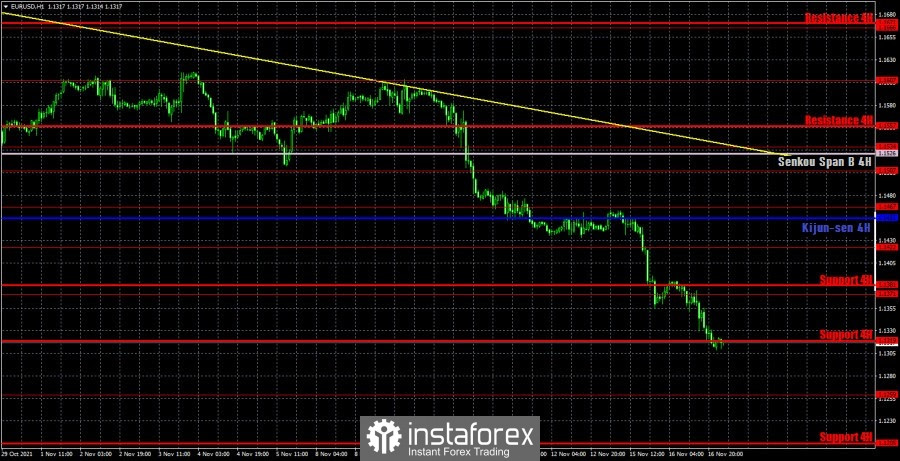
The downward trend persists on the hourly timeframe and does not cause any doubts at this time. The downtrend line is far enough from the price to allow the pair to correct as it pleases without prejudice to the current downward trend. However, it does not need this correction yet. The US dollar is still in demand, and we talked about possible reasons in the fundamental article. We recommend that you read (links below). We highlight the following levels for trading on Wednesday - 1.1259, 1.1371, 1.1422, 1.1467, as well as the Senkou Span B (1.1526) and Kijun-sen (1.1455) lines. The Ichimoku indicator lines can change their position during the day, which should be taken into account when looking for trading signals. Signals can be rebounds or breakthroughs of these levels and lines. Do not forget about placing a Stop Loss order at breakeven if the price moves 15 points in the right direction. This will protect you against possible losses if the signal turns out to be false. On November 17, at first glance, there will be a large number of important events and reports. However, in reality this is not the case. Today is the third and fourth speech of Lagarde in three trading days. Does anyone believe that this time there will be information that is not yet known to the markets? Also, the European Union will publish a report on inflation for October, which seems to be of great importance now. But this is the final value of the indicator and it is unlikely that it will differ from the first, which was 4.1%. Thus, it is unlikely that at least one event today will somehow affect the mood of the markets.
We recommend you to familiarize yourself:
Overview of the EUR/USD pair. November 17. Christine Lagarde, what are you doing?
Overview of the GBP/USD pair. November 17. Brexit and the Northern Ireland Protocol. The conflict has not been resolved.
Forecast and trading signals for GBP/USD for November 17. Detailed analysis of the movement of the pair and trade deals.
Analysis of the COT report

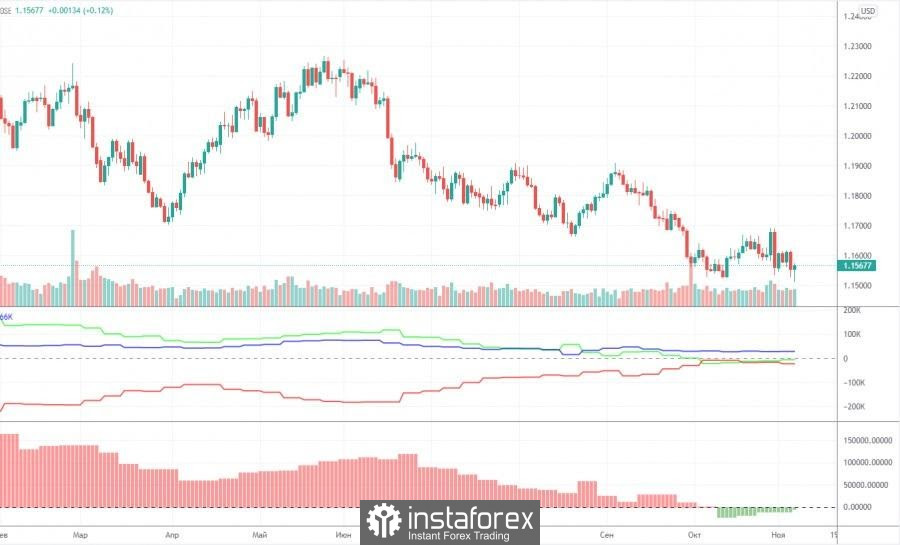
The mood of non-commercial traders changed, but not much, during the last reporting week (October 26-November 1). A group of "non-commercial" traders closed 4,000 buy contracts (longs) and 10.5 thousand sell contracts (shorts) during the reporting week. Consequently, the net position of professional players has grown by 6.5 thousand, which is not so much. However, the changes in the mood of non-commercial traders are best seen by the first indicator in the chart above. The red and green lines have been moving towards each other for a long time, and in the last couple of months they have been almost at the same level. This suggests that the previous trend is ending, and the mood of the major players at this time is as neutral as possible. This is confirmed by the data on the total number of contracts. The non-commercial group has 195,000 buy contracts (longs) and 199,000 sell contracts (shorts). The commercial group has 418,000 buy contracts and 442,000 sell contracts. That is, as we can see, the numbers are almost the same. Therefore, there are theoretical chances for the continuation of the downward movement in the pair. The trend began to end (an upward trend) when the red and green lines (net positions of the commercial and non-commercial groups) began to narrow. That is, for quite a long time. And now, logically, the downward trend continues. However, this "trend" is still not too similar to the trend. Rather, a banal three-wave correction.
Explanations for the chart:
Support and Resistance Levels are the levels that serve as targets when buying or selling the pair. You can place Take Profit near these levels.
Kijun-sen and Senkou Span B lines are lines of the Ichimoku indicator transferred to the hourly timeframe from the 4-hour one.
Support and resistance areas are areas from which the price has repeatedly rebounded off.
Yellow lines are trend lines, trend channels and any other technical patterns.
Indicator 1 on the COT charts is the size of the net position of each category of traders.
Indicator 2 on the COT charts is the size of the net position for the non-commercial group.