Analysis of previous deals:
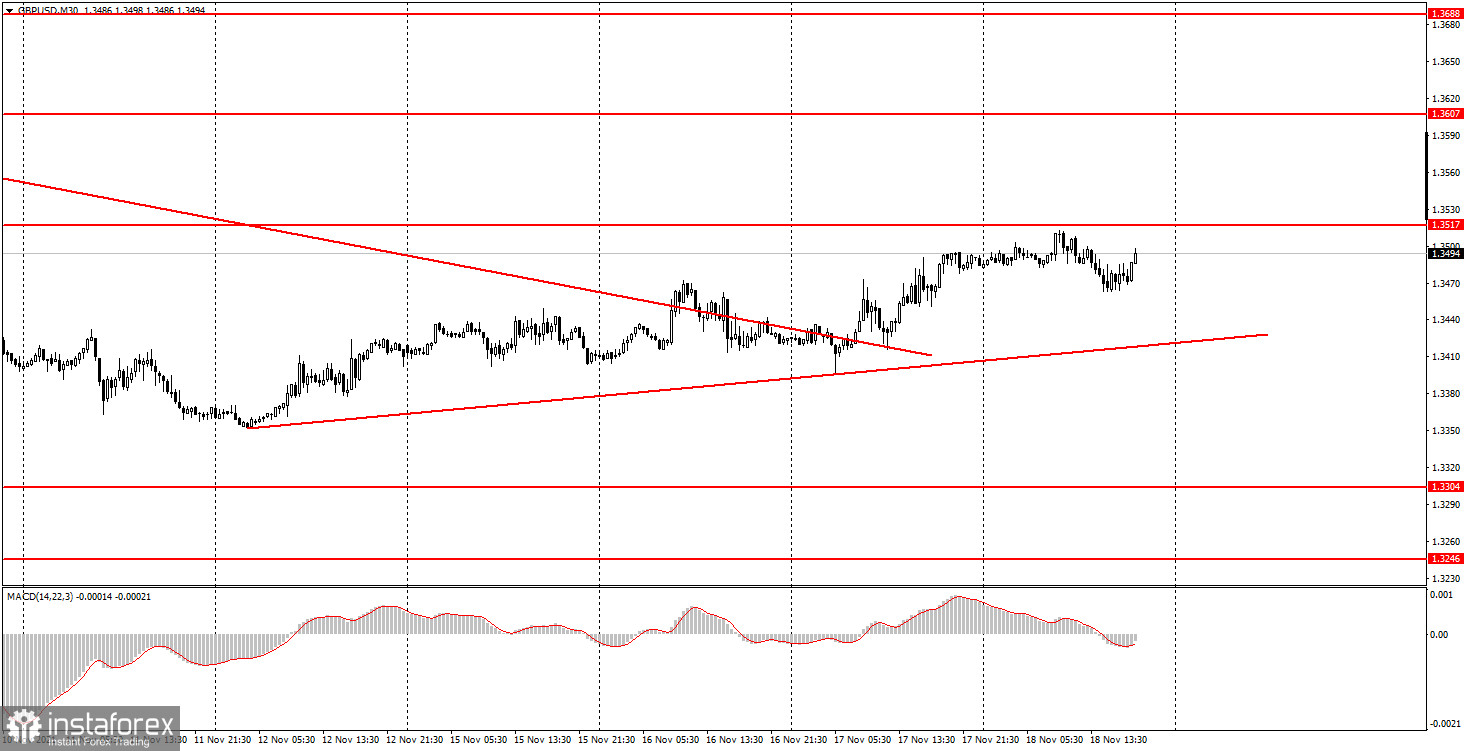
30M chart of the GBP/USD pair
The GBP/USD pair on the 30 minute timeframe on Thursday, November 18, continued to move up after breaking the downtrend two days earlier. So now an upward trend has formed for the pound/dollar pair, which has its own trend line. This trend is very weak, which is clearly seen from the slope of the trend line. Nevertheless, it is there, and the price is approaching the level of 1.3517, overcoming which will allow the pound to continue to rise. Note that during this day, neither the UK nor America has had a single important macroeconomic report. Thus, newcomers had nothing to pay attention to during the day. And the markets had nothing to react to during the day. Therefore, we would call the current growth of the pair exclusively corrective, since the pair had been falling for a long time before it began.
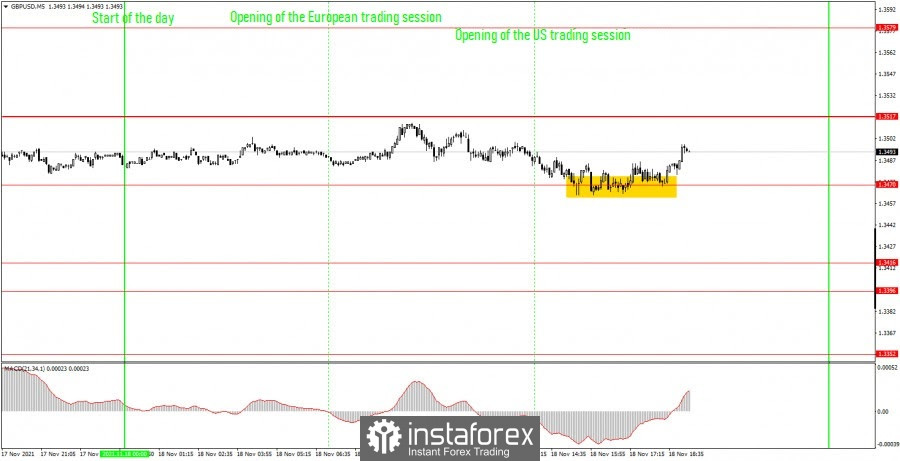
5M chart of the GBP/USD pair
On the 5-minute timeframe, the movement of the pound/dollar pair looks even more boring on Thursday. It seems that the price did not blatantly stand in one place, but it is clearly visible that it moved mainly sideways. A single signal was formed in the US session when the price bounced off the level of 1.3470. Moreover, "bounced" is a big word, since the signal to buy was formed for several hours. But nevertheless, it formed and even allowed novice traders to earn a bit, since the price still went up and passed around 15-20 points in the late afternoon. And the long position should be manually closed in the late afternoon, since it was not possible to reach the nearest target level of 1.3517, and Take Profit was placed at a distance of 40 points and did not work.
How to trade on Friday:
At this time, an upward trend has formed on the 30-minute timeframe, which will persist as long as the price is above the trend line. Thus, long positions are now preferred. A rebound from a trend line can be viewed as a buy signal, a breakdown - as a sell signal. The important levels on the 5-minute timeframe are 1.3416, 1.3470, 1.3517, 1.3579. We recommend trading on them on Friday. The price can bounce off them or overcome them. As before, we set Take Profit at a distance of 40-50 points. At the 5M TF, you can use all the nearest levels as targets, but then you need to take profit, taking into account the strength of the movement. When passing 20 points in the right direction, we recommend setting Stop Loss to breakeven. UK retail sales report for October will be released on November 19. Not the most significant report, but if its actual value differs greatly from the predicted one, then a 20-30 points reaction from the markets can be seen. Otherwise, tomorrow will not be more interesting than today.
Basic rules of the trading system:
1) The signal strength is calculated by the time it took to form the signal (bounce or overcome the level). The less time it took, the stronger the signal.
2) If two or more deals were opened near a certain level based on false signals (which did not trigger Take Profit or the nearest target level), then all subsequent signals from this level should be ignored.
3) In a flat, any pair can form a lot of false signals or not form them at all. But in any case, at the first signs of a flat, it is better to stop trading.
4) Trade deals are opened in the time period between the beginning of the European session and until the middle of the US one, when all deals must be closed manually.
5) On the 30-minute TF, using signals from the MACD indicator, you can trade only if there is good volatility and a trend, which is confirmed by a trend line or a trend channel.
6) If two levels are located too close to each other (from 5 to 15 points), then they should be considered as an area of support or resistance.
On the chart:
Support and Resistance Levels are the Levels that serve as targets when buying or selling the pair. You can place Take Profit near these levels.
Red lines are the channels or trend lines that display the current trend and show in which direction it is better to trade now.
The MACD indicator consists of a histogram and a signal line. When they cross, this is a signal to enter the market. It is recommended to use this indicator in combination with trend lines (channels and trend lines).
Important speeches and reports (always contained in the news calendar) can greatly influence the movement of a currency pair. Therefore, during their exit, it is recommended to trade as carefully as possible or exit the market in order to avoid a sharp price reversal against the previous movement.
Beginners on Forex should remember that not every single trade has to be profitable. The development of a clear strategy and money management are the key to success in trading over a long period of time.